Conversion of traffic from social networks. What do we look at in the metric if we need traffic from social networks? Social Media Analysis: Traffic Overview
Video advertising is primarily a display tool that performs best in the upper stages of the user acquisition funnel. A creative video grabs attention and helps introduce people to a product or maintain an image component.
But video creatives can also be used to solve performance problems. We'll talk about this today.
Let's take a closer look at In-feed placement, which often gives the best ROI. And there are a number of reasons for this:
In contact with
In-feed video advertising on VKontakte is presented in the form of "Universal Post" and "Site Advertising". If you use these formats, your ad will look like a feed post. There are several benefits to being placed on the feed:
- nativeness;
- the ability to add a lot of text;
- Engagement: People notice and respond well to feed ads.

If you use the "Universal post" format, you create a separate post that has all the restrictions of regular posts, and when you click on an ad, the user gets into your group on VKontakte. You can also add a video to a post, but it won't automatically play. You need to add a link to the site inside the post separately, or use a block with a button that will lead to the site.

- title (up to 25 characters);
- description (up to 90 characters);
- image or video (video will automatically play without sound).

Clicking on a post or action button will take the user directly to the site (as opposed to a generic post).
How to create conversion videos
If you want to create a video, you have four main options:
- Contact an advertising agency. The result will be of high quality, but you will have to pay well for it.
- Order a video from a freelancer. It's cheaper, but the result may not be as impressive.
- Film your own video. An acceptable option if you are ready to independently come up with a script, arrange shooting and edit a video. In a word, it all depends on your capabilities.
- Make creative slideshow. This is the easiest option of all, you need to prepare the slides and compose them in a video editor.
- Be sure to include a call to action.
- Include in video detailed description USP.
- Add subtitles so that you can understand the video even without sound, since by default the video plays without it.
- The first five seconds of the video should be as exciting and attention-grabbing as possible. This is necessary to distract a person from watching the feed and switch attention to the video.
- Do not make videos longer than 15 seconds. Ideally, no more than 6 seconds. The speed of content consumption is constantly growing, modern users are not ready to waste their time on videos that are too long.
26.01.2018
If you use the same strategies in in social networks over the years, it might be time to review your goals and make sure your social media tactics are increasing your conversion rate, building brand awareness, and attracting new customers.
1. Double the number of videos on your channels (if you're not already doing so)
Let's face it: Internet users are addicted to video, and that's great for publishers and marketers.
On average, Facebook users consume 100 million hours of video every day. About 82% of Twitter users view videos on this particular medium. Marketers also see positive results with LinkedIn Video, which was introduced last August.
If you want to increase your social media conversion rate, double the channels that are already working for you. For example, if you're seeing more engagement on Twitter than on LinkedIn, it's a good idea to focus your efforts on Twitter.
2. Use Smart, Conversion-Driven Social Sharing Buttons

Today's social media user expects your service to be timely and responsive, even in customer support matters. Why not give them what they want? Send personalized and timely responses, even if it's just customer support advice.

Let's be honest: we've all been on social media for a long time. If your old routine isn't going anywhere, it might be time to change tactics that will boost conversions and even sales. On January 30, we will hold an event where 4 leading experts will tell you what needs to be done to
Reading time: 10 minutes
We will send the material to you:
Today it is almost impossible to find a person who is not registered in one or more social networks. That is why SMM promotion becomes a full-fledged marketing method. The effectiveness of advertising in social networks cannot be ignored, losing the opportunity to use this tool, because it is in Odnoklassniki, Facebook, VKontakte, Twitter, etc. there is a significant part target audience your business.
Why evaluate the effectiveness of advertising in social networks
Planning the marketing activities of the company is impossible without the direct participation of management, which determines the course of business development. When developing a strategy, market indicators are taken into account, on the basis of which it is possible to forecast the dynamics of consumer preferences. Conventionally, they can be called indicators. Data for evaluation can also be obtained in social networks, in which advertising of your brand or product helps to see changes in the characteristics of the target audience (demography, age, location, preferences, interests, etc.).
Each of these indicators is able to answer important questions for marketing strategy and business in general:
Metrics such as budget, resources, timelines, products, and processes can be both quantitative and qualitative in terms of how social media users interact with your brand. In addition, they can be optimized and adjusted to improve the effectiveness of social media advertising. In the long term, improved performance can lead to a more cost-effective allocation of social media investments.
Latest research on the effectiveness of advertising in social networks
The Content Marketing Institute partnered with MarketingProfs to organize a survey of 3,714 marketers from around the world. Content was chosen as the research topic, as well as success in online marketing. Despite only 263 respondents being B2C marketers and business owners, the results of the survey were found to be indicative.
Sponsored posts (for example, posts on Facebook or Twitter and Pinterest) are used by 76% of B2C marketers. 61% of them confirmed the effectiveness of this type of advertising in social networks, the effectiveness of which was rated at 4 or 5 points on a five-point system (3 shows a neutral attitude).
Advertising on social networks itself received a rating of 4 or 5 points on the effectiveness scale from 59% of respondents (this method of promotion is used by 74% of all respondents). Facebook was recognized as the most successful platform for promotion, Youtube took the second place.
The effectiveness of social platforms for B2C:

Most of the respondents who took part in the CMI survey belong to the B2B sector (1521 people). Of these, 93% use social media advertising: 52% - advertising posts, 41% - advertising directly. 48% of marketers rated these tactics a 4 on a 5-point effectiveness scale, 45% a 5.
However, 55% of B2B professionals rated above average (4 or 5) paid search ads, as well as PPC (Pay-Per-Click - pay per click). And only 29% of respondents consider traditional banner advertising to be sufficiently effective or super effective.
The effectiveness of social platforms for B2B:

What are the metrics for evaluating the effectiveness of social media advertising?
Social network users are partly attracted to metrics that allow you to see how many subscribers your community or channel has, how many comments, likes and reposts your content has. Business owners should also pay attention to these indicators in order to measure them and evaluate the opening effectiveness of advertising for the company.
Lecture hall
Entrepreneurs rely on the target audience being aware of their brand and the services they offer. This awareness can be measured using the following criteria:
- The number of subscribers, that is, those people who are in your community on a social network and regularly receive mailings about content updates.
- Dynamics of audience growth, showing the increase or decrease in the number of subscribers over a certain period of time.
Awareness is upper part sales funnels. Here are such incentives for customers as an incentive to realize the need, the desire to satisfy their requests and loyalty to the company.

Submit your application
Coverage
The reach indicator reflects how many users of the total audience of the social network have watched your content, including paid advertising. This indicator is applicable both to a single post and to the entire page. With it, you can evaluate the effectiveness of advertising impact on the target audience.
Involvement
There are 4 main ways to interact with the audience using social networks. They allow you to measure the reaction of the audience.
- Likes, with which you can see the number of users who have viewed and rated your content.
- Comments that demonstrate the effectiveness of your content, which stimulated users to enter into a dialogue.
- Reposts that reflect the increased interest of the audience that found your content relevant for posting on their pages, as well as for further distribution.
- Mentions, showing how many times your brand name is quoted during user interactions.
The more activity the audience demonstrates, the higher the effectiveness of advertising in social networks. The engagement indicator helps you gauge the degree of user interest in your content. Thanks to this, audience loyalty grows, which in the future can lead to an increase in sales.

social mood
This indicator is one of the most revealing. By researching social mood, you get the opportunity to assess the attitude of users towards your company and find out what people are saying about your brand.
The difficulty lies in the fact that in the process of communication, social network users can mention your brand without referring to it directly. To understand in what context the audience is talking about your company - in a positive or negative way, specialized services are involved that are used by marketers for evaluation. Sentiment analysis of reviews is carried out on the basis of specified key parameters. The higher the percentage of mentions of your brand on social networks, the higher the effectiveness of advertising on social networks. In addition, by measuring social mood, you get the opportunity to quickly respond to criticism and adjust your strategy to avoid the appearance of negativity in the future.
With the help of specialized services (for example, ReviewPro), the social mood of your audience can be expressed in numbers that are easy to use when evaluating the effectiveness of advertising on social networks.
Share of advertising exposure (SOV - Share of Voice)
Measuring this indicator can help:
- Evaluate the effectiveness of advertising in a social network, that is, answer the questions:
- Clarify the degree of recognition of your company (whether customers mention your brand on their own during communication or only after actual advertising or promotions).
- Supplement the analysis of competitive activity:
Customer acquisition
In the matter of achieving business goals, activities in social networks simply cannot be based only on communications with users. The task of marketing activities in social networks is to create a need for services, to generate leads and to increase sales.
Based on these goals, you should create your own sales funnel and create a channel for profiting from promoting your brand on social networks. Many social media platforms offer the user the ability to generate a standard traffic report. However, to conduct a full-fledged analysis, it is better to involve specialized services, for example, Google Analytics, which helps you evaluate the effectiveness of your marketing efforts, which contributed to the transition of potential customers from your page on a social network to a corporate website. With the help of UTM links placed in posts, Google Analyticscs helps to find the traffic channel and evaluate whether it led to the generation of a lead and the closing of a deal.
How to evaluate the effectiveness of advertising in social networks: the main stages
Step 1: Define your social media marketing funnel
This process consists of several stages:
- Acquaintance.
The tasks of this stage include attracting the attention of users and stimulating their interest in your brand.
- Involvement.
You can engage users with entertaining or educational content, thanks to which an interested audience participates in the discussion by leaving comments, and distributes it with the help of reposts.
- Conversion.
Now it's time to convert interested users into future buyers by offering them an attractive product, filling out a form, or signing up for a newsletter.
- Involvement.
One of the great features of social networks is that users who enter the sales funnel involve other people with their activity. Therefore, the number of your potential customers is constantly growing, and each of them leads to your sales funnel people who are part of the circle of friends and relatives.
Step 2: Define social media attribution for business
Social media attribution- the process of identifying revenue channels, campaigns and publications. This is where Google Analytics comes to the rescue. However, not all attribution models offered by this service are suitable for social networks.

Assuming that your brand was first introduced to you by watching a video on Facebook, the next user steps would look like this:
- After visiting your brand page, the user subscribes to it in order to receive regular updates.
- After a couple of days, your page is replenished with an article, which can be read in full only on your site, where the link in the post leads.
- The user goes to your site and subscribes to the newsletter to keep abreast of new products and current events.
- A week later, the user receives an email with a code, by entering which on your site, he receives a discount on the product that attracted his attention on the page on the social network.
Google Analytics offers last-click attribution, but it doesn't take into account social media influence. In this case, multi-touch attribution is more effective, with which you can track all the channels of the user that led him to purchase.
Stage 3. Calculation of CPA in social networks
CPA (cost per acquisition, acquisition costs) is an advertising model in which the advertiser pays only for certain user actions: clicks, subscriptions, purchases, registrations.
When you run a Twitter campaign and use it to grow followers, you can see how many people in that audience have become customers (that's the acquisition). If you know the amount of investment spent on publishing, you can calculate the cost of acquisition by dividing the price of a posted post by the number of users who eventually clicked on your link and subscribed.
Stage 4. Calculation of ROI of social networks
ROI = (income minus investments) * 100 / investments
Social media revenue is calculated using an attribution model. If we assume that the income from one conversion action is $120, of which 30% belongs to social networks (this was suggested by the attribution model), then the ROI will be equal to $40. Of course, this indicator is not always accurate, but it gives an idea of the level of expenses.
Social media is an important source of lead generation for business, especially B2B. If you follow the algorithm outlined above, it will help you evaluate the effectiveness of social networks for your chosen marketing strategy, as well as adjust your actions within this policy in order to stimulate profit growth.
How to determine the effectiveness of advertising in social networks depending on the type of project
- Shops (services), whose activities are carried out only in social networks.
For such sites, the effectiveness of advertising on social networks is calculated very simply, since all sales are carried out only here. Profit is the sum of the cost of all goods sold, and the amount of costs is determined by the cost of production, increased by the amount of investment in promotion in social networks. In this case, the ROI indicator is calculated using the following formula:

D- income from the sale of goods;
Z1- the total cost of goods;
- Public pages and groups whose income is based on the publication of paid guest posts, links to partnership programs etc.
For these sites, the effectiveness of advertising in social networks is also easily calculated using the formula of the ratio of profit to total costs, which is presented above. In this case, the income part is the total cost of all paid posts for the period under consideration (month, quarter, etc.). The cost part includes the cost of man-hours for the reporting period, as well as the amount of investment in the promotion of the group.

- Shops (services) and companies selling services for which social networks are one of the promotion channels in the general sales funnel.
For these sites, it is rather difficult to evaluate the effectiveness of advertising in social networks, since it is difficult to find the weight of a separate promotion channel in the overall range of ongoing marketing activities. Therefore, first you need to find the right approach that will help simplify the task of calculating the ROI of social networks.
Types of advertising that show the greatest effectiveness of advertising on social networks
- Branding.
Brand awareness is the key to its winning position against competitors. With the help of social networks, you can reach a huge target audience, the size of which exceeds the number of viewers of television advertising. Do not ignore the effectiveness of social media as a tool to increase brand awareness.
- Hidden marketing.
Pop-up full-screen banners and other annoying ads have long taught social network users to close such pages without even getting acquainted with their content. In this regard, there was a need for such advertising in social networks, the effectiveness of which is expressed in the hidden manipulation of the attention of visitors.
This approach requires patience. To begin with, around your brand, you need to gather an audience loyal to it, and then proceed with promotion, which is free from the obtrusiveness of conventional advertising, but at the same time pursues the same goals. Most firms for which social media is one of the main promotion channels emphasize the effectiveness of social media advertising.
- Viral marketing.
High-quality viral marketing can require much more effort and qualifications. Generate viral content and achieve it rapid spread very difficult, but the effectiveness of such promotion in social networks is really great. In this case, humorous or curiosity content that will help increase brand awareness is a great help.
- Black PR.
Black methods are quite unpredictable, because in the end, the "dirt" may also be on the company that sought to denigrate competitors. In this case, you should act more skillfully and delicately, not descending to the level of spreading gossip and false information in order to push the user to the idea that the reputation of competitors is much more modest compared to the brand in question.
All your actions within the framework of applying the black PR methodology should not leave "tails" so that competitors do not have the opportunity to prove your involvement in what is happening or make claims.
How to improve the effectiveness of advertising in social networks
- Use the social potential of your employees.
About 89% of brands-advertisers use free marketing tools in social networks, thus generating their own advertising campaigns. 71% of agencies whose clients place an order for business promotion also use them. At the same time, 81% of agencies implement marketing campaigns for their customers using paid social media tools. They are also used by 75% of companies promoting their brand on their own.
From this we can conclude that most brands prefer to use their own resources and free social media tools to promote and generate content, as well as to interact with the target audience. At the same time, third-party agencies are most often used to create and publish paid ads.
If the experience and qualifications of your employees can effectively participate in promoting your brand on social networks, you have the opportunity to save money. In addition, communication with users will be more personalized.
- Post ads on social networks used by your target audience.
The results of market research confirm that a significant part of advertisers is convinced of the need to increase the cost of advertising in social networks. The effectiveness of this approach is beyond doubt. However, 40% of respondents plan to increase the budget by only 10% or even less. This means that brands are aware of the high performance of paid ads on social networks, but they are not ready for significant investments in this promotion channel.

If your budget is limited, every little thing should be taken into account. To increase the effectiveness of advertising on social networks at minimal financial cost, carefully choose the time and place for publication, and for this you need to know everything about the features of social networks that your target audience prefers.
- Use social media to increase your audience reach.
Television and other types of advertising are gradually losing their positions. The effectiveness of advertising in social networks is recognized by the majority of advertisers, 40% of which increase investment in this type of promotion. It is social media that is recognized as the very phenomenon of modernity, which combines various channels for the dissemination of information. If we turn to the results of marketing research, curious facts are revealed:
- Over 50% of advertisers promote their brand through offline advertising and paid ads on social media. This is due to the fact that with equal costs of creating advertising, the cost of posting on social media is lower.
- More than 25% of advertisers reallocate their marketing budget to social media advertising.
- About 75% of brands conduct marketing campaigns both on the pages of their own corporate website and in online communities.
With the help of advertising on social networks, you can significantly increase the reach of your target audience, since these sites provide a wide range of paid and free tools. The easiest way to attract users is to promote your community with ads while posting interesting content.
- Determine the goals and objectives of the advertising campaign in social networks.
To drive sales growth on social networks, you first need to purchase advertising on these sites, with which you will attract the target audience and engage them in interaction. Placing a paid ad in online communities does not generate an immediate increase in profits through sales. However, it is quite possible to turn every subscriber of your community into a buyer. The main thing is to give him something that can interest him, that is, a product with which you can evaluate the effectiveness of advertising on social networks.
- Create a relevant landing page for social media users on your site.
More than half of advertisers believe that the same criteria can be used to evaluate the effectiveness of paid ads in online communities and offline advertising, for example, sales growth, brand awareness and free publications about the company. However, advertising using paid tools on social networks does not always guarantee an increase in sales of your product. Only 10% of ad sellers in online communities are committed to achieving such a result. In addition, other criteria are used to evaluate the effectiveness of advertising on social networks, which are used by almost half of the sellers.
To get the most reliable results, you need to analyze the performance yourself. To do this, you can create a landing page on the corporate website for users who follow the advertising links of social networks. Keep a count of the visitors who completed the necessary steps to start the sales process.

However, not all visitors are ready to complete the transaction immediately after the first visit. That is why your landing page should have compelling content that will help the user continue to explore your business. For example, you can offer potential clients discount for registration on the site.
- Measure the effectiveness of social media advertising.
However, almost a third of advertisers doubt the ability to measure the effectiveness of paid advertising in online communities. To obtain data, it is enough to choose the appropriate metrics that will be most effective for evaluating your particular campaign. For example, you can evaluate the result using the number of subscribers attracted by a marketing campaign or the number of mentions of your brand in online communities. Such indicators will be useful for analyzing the effectiveness of advertising in social networks.
- Use social media advertising to both inform customers about your brand and to support sales.
After launching a social media campaign, almost 50% of advertisers expect sales and brand awareness to increase. It is necessary to gradually involve users in the conversion process, attracting their attention during the first visit to your page on social networks.
With the help of advertising in online communities, brands get the opportunity to start interacting with the audience and inform potential customers about the product and new products. However, social media promotion can also act as a sales support tool. The main thing is to choose the appropriate methods and evaluation criteria.
Array ( => 25 [~ID] => 25 => 22.10.2019 21:33:47 [~TIMESTAMP_X] => 22.10.2019 21:33:47 => 1 [~MODIFIED_BY] => 1 => 22.10. 2019 21:33:47 [~DATE_CREATE] => 10/22/2019 21:33:47 => 1 [~CREATED_BY] => 1 => 6 [~IBLOCK_ID] => 6 => [~IBLOCK_SECTION_ID] => => Y [~ACTIVE] => Y => Y [~GLOBAL_ACTIVE] => Y => 500 [~SORT] => 500 => Articles by Maxim Pushkarev [~NAME] => Articles by Maxim Pushkarev => 12012 [~PICTURE] = > 12012 => 9 [~LEFT_MARGIN] => 9 => 10 [~RIGHT_MARGIN] => 10 => 1 [~DEPTH_LEVEL] => 1 => Maxim Pushkarev [~DESCRIPTION] => Maxim Pushkarev => text [~DESCRIPTION_TYPE ] => text => Maxim Pushkarev's articles Maxim Pushkarev [~SEARCHABLE_CONTENT] => Maxim Pushkarev's articles Maxim Pushkarev => stati-maksima-pushkareva [~CODE] => stati-maksima-pushkareva => [~XML_ID] => => [~TMP_ID] => => [~DETAIL_PICTURE] => => [~SOCNET_GROUP_ID] => => /blog/index.php?ID=6 [~LIST_PAGE_URL] => /blog/index.php?ID=6 => /blog/list.php?SECTION_ID=25 [~SECTION_PAGE_URL] => /blog/list.php?SECTION_ID=25 => blog [~IBLOCK_TYPE_ID] => blog => blog [~IBLOCK_CODE] => blog => [~IBLOCK_EXTERNAL_ID] => => [~EXTERNAL_ID] =>)
Social networks can bring you tons of free traffic, do not require initial investment and scale well. But to achieve the ultimate goal, you need to understand whether you are moving in the right direction at all.
We already wrote in a previous article that when evaluating performance indicators in social networks, you should pay attention to such indicators as engagement rate (Engagement Rate), reach and growth of subscribers (Reach and Follower Growth), customer acquisition (Acquisition) and associated and direct conversion (Assisted and Direct Conversion). And if everything seems to be clear with the engagement rate, reach and growth of subscribers (the data can be viewed on social networks, or in the KUKU.io extension for social network analysis), then such important performance indicators as customer acquisition and associated and direct conversions can unfairly stay away.
Fortunately, Google Analytics, combined with social media analysis services, gives us information about more than just traffic sources, visitor paths, demographics, and conversions. WITH Google Analytics, you can also learn about how social networks affect the final conversion, how much money they bring popular social networks from your list, which links attract the most attention the extent to which the content you publish is capable of retain and reengage your audience.
That sounds good. Now I propose to see where to find this data in Google Analytics.
If you want to receive data from Google Analytics on social networks, you need to start with Google Connections Analytics to your site and Goal settings (as a result, conversion tracking). As goals, you can choose registration, subscription, launch trial period, click on the button "Download", "Buy" or, for example, "Add to cart". You can learn more about setting goals in Google Analytics here:
If you need to set a button click as a goal, you can find information on how to set up the necessary events and virtual pages in this article.
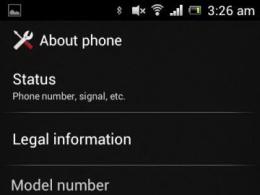
Once the goals are set and you have verified that the data is being collected correctly, we can move on to the next steps. You can find social media reports in the Traffic Sources tab:
- Sign in to Google Analytics and open the Reports tab.
- In the left menu, select the "Traffic Sources" tab.
- Select Social Features.
Next, you can select the tab that you are interested in, here you can find: a general overview of traffic, information on conversions, landing pages, as well as recent social media activities (which will most likely be useless to you, and below I will tell you why) , backlinks, user paths and plugins.
Social Media Analysis: Traffic Overview
Here you can see a graph of the importance of social networks. Google Analytics strips away all the (unnecessary?) information and shows you an exciting bunch of sessions and conversions.

Conversions. In the upper screenshot, the number 1,199 is the total number of all conversions from absolutely all traffic sources (direct, referral, social networks, etc.) for the selected period.
Assisted Conversions. Can be displayed automatically in place of the “conversions from social networks” item or calculated as the difference between “conversions from social networks” and “conversions from the last interaction”. Assisted conversions are those conversions that social media has helped you with. Visitors went from social networks at least once to your site without making a conversion, but their subsequent transitions from other sources led to the desired result.
For example, a person saw your post on Facebook and went to the page and left it. A few days later, he remembered your service or product and returned by signing up, subscribing, making a purchase, and so on. By the way, after how many days, you can see in the "Time to conversion" tab.
Of course, there are "BUT" here. For example, if a person used one device during the first transition, say, a mobile one, and came back to make a conversion from another, then the associated conversion will not be credited to the social network. However, looking at this indicator, you can track the overall trend and observe the whole picture.
Direct conversion (Last interaction conversion). This is the conversion that users make through a direct transition from social networks.
To display this interesting chart, goals must be set up initially. If you want to display not only goals, but also the money that conversions from social networks bring you, assign a value in the goal settings.
Social Media Statistics: Clicks
In this tab, you see two graphs: sessions from social networks and all sessions. And now I have good news and bad news. I'll start with a good one. You don't need to set anything up to see the conversions and the growth trend of social media conversions. All data on conversions from Facebook, Twitter, Vkontakte, Google+, etc., is automatically calculated by Google Analytics. If you are well mentioned on social media or people like your content, share it, like it and click through, you will see rises in the graph.
The bad news is that this information may not be accurate. For example, if you use any link shortening service to analyze social networks (say, to attach a UTM tag), click-through data will fall into direct or referral traffic and will be displayed in the “all sessions” graph, and not “sessions from social networks”. networks."

Add a "New Users" and "Repeated Users" segment to get an overview of the ratio of new visits to repeat visits.
As we already wrote, when talking about attracting users from social networks, it is impossible not to start with the frequency of transitions to your site. The metric divides visits to your site into two main categories: new and repeat. While repeat clicks reflect the performance of your content on social media and audience engagement, new clicks show whether by increasing “reach” you actually get more clicks.
Social media activity
Social Data Hub is a free platform for integrating various social media activity feeds including votes, comments and +1 with Google Analytics.
In the Social Media Activity tab, you'll see the latest posts and conversations around your brand. But when I talk about social media, I don't mean Facebook and Twitter, or Pinterest, Tumblr, LinkedIn, and others. The Social Data Hub, with the help of which this data is loaded, has support for such social networks as Google+, Reddit, Disqus, and, fortunately, the owners of Vkontakte pages and groups, and this social network. Full list:

So when using this information in Google Analytics, remember that this is only a SMALL part of all the social activity around your site.

Social Media Analysis: Entry Pages
There are at least two ways to track how many hits your blog post or social media page is getting. The first way is to set up UTM tags automatically through the delayed posting application or through the Google Link Builder. If you need to quickly see the number of clicks from social networks on a specific link, go to the "Entrance Pages" tab.

By clicking on the link, you will see the breakdown of the number of clicks on specific social networks. Let's say our article on the KUKU.io blog on Vkontakte lead generation methods received 164 clicks, 154 of them from Facebook and 10 from Vkontakte. We still need to work on promoting content on this social network. :)
Social networks and website conversion
Let's move on to the most interesting and indicative indicator, conversions. When we talk about evaluating the effectiveness of online marketing, we often talk about the final conversion into a buyer, as well as the return on investment. But the thing is that social network users do not always directly convert into your users on the site, and this is the difficulty in analyzing the effectiveness of social networks. On the other hand, do not neglect the need for brand presence in social networks.
And while search engines, email newsletters to subscribers and other channels bring instant results, social networks increase brand awareness and ultimately bring new users, but through other channels. These are associated (or assisted) conversions.
In the Conversions tab, select Assisted and Last Click Conversions. In the table you will see data for each social network:
- Assisted Conversions. Visitors went from social networks at least once to your site without making a conversion, but their subsequent transitions from other sources led to the desired result.
- Assisted Conversion Value. Let me remind you that you can set the value of the final goal in the goal settings.
- Last click or direct interaction conversions. The number of conversions where the channel was the last interaction on the way.
- Value of last click or direct interaction conversions.
- The ratio of associated and direct conversions. By comparing Assisted Conversions with Google Analytics Last Click Conversions, you can determine which social networks are ideal for building relationships with existing clients, and which ones are for conducting and making new transactions.
At first glance, evaluating the ratio may not seem obvious, but here's a hint: if the value in the last column closer to 0, which means that traffic from social networks is converted into registrations / sales / subscriptions, but does not force users to return to your product after a while, thereby affecting the associated conversion of the site, indicator, close to 1, indicates a balance between associated and direct conversions. The higher it goes from 1, the greater the role social networks play as auxiliary sources.
In the case of KUKU.io (our service for SMM), we try to focus on promoting and developing the brand in social networks, so Facebook and Vkontakte are channels for attracting new users for us. At the same time, statistics show that our Twitter profile is currently not bringing any results at all, and we urgently need to do something about it.

However, for other projects, the picture may be diametrically opposite. For example, the data of another site is a prime example of the balance of associated and direct conversions. We can conclude that visitors both go from social networks (in particular, Facebook), to our page, leave, and return again from other sources, and make a conversion by direct click.

If you have multiple conversions set up on your site, you can select the ones you want to view data for from the drop-down list above the graph.
Once you get to this point, you will probably find it interesting to see assisted conversions not only for traffic from social networks, but also for other sources. If so, follow the steps:
- Open the "Conversions" tab.
- Select "Multichannel Sequences".
- Select Assisted Conversions.

Google Analytics also shows you not only how much traffic is coming to your site from each social network, but also helps you see the role of social networks in your overall acquisition strategy. To do this, select "Conversions", then "Multi-Channel Funnels" and "Main Conversion Funnels". In our case, social networks are involved in 4 of the 10 main conversion paths:

Social media plugins
Google Analytics should help us track clicks on buttons on social media widgets embedded in a website, blog, or app. But if I open the "Plugins" tab, I, like most of you, will see this picture:

Something is missing? Yes data!
The fact is that Google Analytics automatically collects information only on the Google+ button. Unfortunately, in order for data on the buttons of other social networks to appear here, it is not enough to copy a few lines from the documentation into the site code. You need to make the appropriate settings for each individual button, much like setting up events and targets.
In order to set up button interaction tracking, you need to set up the _trackSocial tracking method, which will send data to Google Analytics as soon as the user clicks on the social button.
Facebook Plugin
So, if you want to save data about likes, unlikes of your pages, as well as people who shared your page, you can paste the following code on the page you want to track data from and which has a Facebook plugin:
Ivan Ivanichev
![]()
In February, we published an article "Analysis of indicators for tracking the effectiveness of Internet marketing". Readers liked the material and demanded more.

You asked - we did: we tried to collect all the most important indicators for the analysis of social media marketing. The information will be useful to texters, managers and business owners.
Warning to customers: do not go to extremes, evaluating SMM either on one indicator or on all at once. In the first case, a single metric shows a distorted picture and is easily cheated by an unscrupulous performer. The second method of evaluation requires too much time and effort.
Metrics for evaluating the dynamics of subscribers
Let's start with metrics that reflect the dynamics of subscribers and, therefore, the effectiveness of the SMM strategy as a whole.
- Number of followers (Followers)
Perhaps the most famous metric in SMM: it is widely used in reports, put as a KPI. Of course, followers can be cheated, but such cheating is easy to calculate.
If there are suspicions, it is necessary to study the accounts of newcomers - bots and "dogs" are immediately visible. At the same time, it is worth comparing the geography, age and other important data of new subscribers with portraits of the target audience. Characteristics differ greatly - questions to the SMS.
Read more about the independent search for bots in social networks and services for identifying fake accounts in the article by Dmitry Dementy.
Formula: (number of new subscribers / total number of subscribers) * 100%.
The formula can also be improved by substituting into the numerator net increase: the difference between the number of new subscribers and the number of those who left the community. This will make it easier to assess the interest of the audience, the relevance of posts and the effectiveness of advertising, if it is included.
- Number of views (Views)
For reports, as a rule, a summary indicator is used: the number of views on all community posts for a certain period.

- Reach
Reach measures the number of people who have had at least one contact with a community post(s).
As in the case of the previous indicator, in general, customers are reported on the total coverage. It is considered separately if there is an intermediate task: to compare the effectiveness of several posts.

Viral Reach directly depends on the interest in the content, paid reach from the advertising budget. On the organic reach the number of subscribers and the frequency of publishing content affects, but there is also an irresistible force - ranking algorithms in social networks.
If KPI's are limited to the dynamics of subscribers and posting, Peakfeed is suitable for tracking. He knows how to work with 8 social networks (VK and OK, however, are not included in the list). The cost is from $5 per month.
Tracking most important metrics - subscribers, reach, views, and engagement metrics (which will be discussed in the next section) - is best handled by Livedune. Tariffs start from 195 rubles. Livedune knows how to work with all Russian social networks and even LiveJournal.

Audience Feedback Metrics
Now about the metrics that reflect various user reactions. Likes (likes), comments (comments), shares or reposts (shares)- the simplest, well-known, but not the only indicators of evaluation feedback audience.
- Attractiveness level (Love Rate)
Likes in terms of audience size. Formula: Likes / Followers * 100%.
- The level of sociability (Talk Rate)
Comments in terms of audience size. Formula: Comments / Followers * 100%.
- Amplification Rate
Synonymous with growth rate. Formula: Shares / Posts (number of posts) * 100%.
AR characterizes the virality of content. The higher the indicator, the greater the free reach and the cheaper it is to attract subscribers.
Sometimes likes, shares, comments and coefficients for them are not counted separately, but they take a more general indicator - engagement volume. Formula: Likes + Comments + Shares.
- Audience Engagement Rate (ER)
There are several ER formulas.
One calculation option is to take the number of community members who have made at least one engagement (like / repost / comment), then divide it by the total number of subscribers.
There is also such a formula: (sum of all engagements / number of subscribers) * 100%.
Advice to specialists from Daria Samoilova, SMM manager at Netology: “If you report on subscriber growth, try to show it in conjunction with ER. Because the best guarantee of the absence of bots and "dead souls" is a growing or at least not falling engagement in the account. It is important".
The disadvantage of the indicator is that it is subjective: it does not take into account reach, engagement on specific days, and interaction with individual posts. Therefore, experienced texters use several subspecies of ER.
- Engagement Rate by Reach (ERR)
Formula: (number of engagements / coverage) * 100%.
The metric shows the approximate share of those who have seen community posts and reacted to them in one way or another.
- Engagement per day (Daily Engagement Rate, ER Day)
Formula: (number of engagements per day / number of subscribers) * 100%.
Daily engagement shows how many times a day the average subscriber has been active.
- Engagement Rate of Post (ER Post)
Formula: (sum of engagements per 1 post / number of subscribers on the date of publication) * 100%.
The indicator allows you to evaluate interest in specific publications, compare posts with each other in terms of effectiveness.
- Engagement Rate by Views (ER View)
Formula: (number of engagements per 1 post / number of views) * 100%.
You need to be careful with conclusions on this indicator, because social networks do not count unique views.
- Average response time (response time)
The metric reflects the time required by the community administration / brand representatives to respond to messages from the audience. This is an important indicator of the quality of service, respect for customers.
To estimate the average response time over time, you can use the following formula: (response time for the previous period / response time for the reporting period - 1) * 100%.

- Response Rate
The metric shows the proportion of questions that users received an answer to. Formula: (number of answers / number of questions) * 100%.
According to JagaJam's Russia data, brands are slow to respond and don't even answer half of the questions.
Conclusion: with the help of quality service, you can overtake most competitors.
For regular monitoring of responsiveness, the same JagaJam is suitable. It can collect statistics on both your brand community and competitor groups. In addition to the response rate, the service can calculate subscriber dynamics, engagement, and other important SMM indicators. Tariff plan Personal in JagaJam - 2,700 rubles per month.
There is also a foreign service for improving the quality of customer service in social networks - CX Social. It monitors publications that mention the brand and notifies them in a timely manner. Pricing unknown, but a demo can be requested.

Metrics to measure traffic and conversions
The metrics from the previous sections are mostly about the inner workings of SMM. Businesses are interested in sales. We tell you how you can evaluate the efforts of an SMS person to bring the audience to a purchase.
Important: you can’t set KPIs for sales, as they are influenced by many other factors that are not dependent on SMM.
Leah Kanarskaya, a remote SMM manager, says: “Very often, you can hear the following from potential clients:
- “Ten thousand will make a hundred thousand profit?”
- "Do you guarantee plus 1,000 subscribers?"
- "We'll pay you a percentage of sales."
But SMM affects sales and profits only indirectly. Social networks do not form the need of consumers, it is just one of the channels of brand communication.”
- Traffic from social networks (Social Traffic).
It’s definitely not worth it in the first 2-3 months after the creation of the community to set strict requirements for the traffic to the site for the SMS. Keep in mind that it takes time to form trusting relationships: new subscribers are in no hurry to follow links to unfamiliar sites.
- Conversion rate or click-through rate (Click-Through Rate, CTR).
A basic indicator in online marketing, it is used at almost all stages of the sales funnel.
CTR in SMM can be calculated as follows: divide the number of clicks on the link by the number of post impressions, and multiply the result by 100%. If the site is promoted by targeted advertising, click-through rate is calculated in the same way: ad impressions are simply substituted into the denominator.
- Cost Per Click (CPC).
This indicator is known to everyone who has ever set up a targeted or contextual advertising. However, CPC can also be calculated for general SMM using the following formula: all costs of maintaining social networks / number of clicks to the site.
- The number of leads (Leads).
The metric shows the number of contacts of potential customers, that is, the number of applications / orders / calls received using social networks.
- Cost per lead (Cost Per Lead, CPL).
Formula: (sum of expenses / number of leads).
Leads and CPL are easy to calculate when managers process leads using social media apps. Try to offer potential customers as many options for ordering as possible: not everyone finds it convenient to fill out forms on landing pages, put goods in the baskets of online stores.

Once again, we will touch on the topic of the number of KPIs.
Especially for Texterra, Daria Samoilova, SMM manager of Netology, spoke about her experience:
“For me personally, 5 metrics are optimal: traffic to the site, conversion to leads, subscriber growth, reach, Engagement Rate. This is a necessary basis from which, without further ado, the effectiveness of the work is visible.
Someone adds to the ER a breakdown by communication, amplification, engagement indexes - that is, they count comments, reposts, likes separately. Then you can get eight metrics.”
- Work period.
- Number of community members (as of the report generation date).
- Growth of subscribers in 1 month.
- Full coverage of the audience.
- The number of unique visitors.
- The total number of post views.
- Number of posts (messages).
- News update frequency.
- Top 5 popular posts (by reach).