Description of the functional model of idef0. Basic Organization Survey Methodologies
The process of business modeling can be implemented within the framework of various methods, which differ primarily in their approach to what constitutes a modeled organization. In accordance with different ideas about the organization of methods, it is customary to divide them into object and functional (structural).
Object Methods consider the modeled organization as a set of interacting objects - production units. An object is defined as a tangible reality - an object or phenomenon that has a clearly defined behavior. The purpose of applying this technique is to identify the objects that make up the organization, and the distribution of responsibilities between them for the actions performed.
Functional Methods, the most famous of which is the IDEF methodology, consider the organization as a set of functions that transforms the incoming information stream into an output stream. The process of converting information consumes certain resources. The main difference from object technique consists in a clear separation of functions (data processing methods) from the data itself.
From the point of view of business modeling, each of the presented approaches has its own advantages. The object approach allows you to build a system that is more resistant to changes, better matches the existing ones. organization structures. functional modeling shows itself well in cases where the organizational structure is in the process of change or is generally poorly designed. The performed functions approach is intuitively better understood by performers when receiving information from them about their current work.
Functional methodology IDEF0
The IDEF0 methodology can be considered the next stage in the development of the well-known graphical description language functional systems SADT (Structured Analysis and Design Technique). Historically, IDEF0 as a standard was developed in 1981 as part of an extensive industrial automation program that bore the designation ICAM (Integrated Computer Aided Manufacturing). The IDEF family of standards inherited its designation from the name of this program (IDEF = Icam DEFinition), and its last edition was released in December 1993 by the US National Institute of Standards and Technology (NIST).
The purpose of the technique is to build functional diagram of the system under study, which describes all the necessary processes with an accuracy sufficient for unambiguous modeling of the system's activity.
The methodology is based on four main concepts: functional block, interface arc, decomposition, glossary.
(Activity Box) is some specific function within the considered system. According to the requirements of the standard, the name of each functional block must be formulated in the verbal mood (for example, "to produce services"). In the diagram, a functional block is represented by a rectangle (Fig. 6.1). Each of the four sides of the functional block has its own specific meaning (role), while:
- the top side is "Control";
- the left side is "Input";
- the right side is set to "Output";
- the bottom side has the meaning "Mechanism" ( Mechanism ).
Rice. 6.1.
Interface arc(Arrow) displays the element of the system that is processed by the function block or otherwise affects the function represented by this function block. Interface arcs are often referred to as flows or arrows.
With the help of interface arcs, various objects are displayed that, to one degree or another, determine the processes occurring in the system. Such objects can be elements of the real world (parts, wagons, employees, etc.) or data and information flows (documents, data, instructions, etc.).
Depending on which side of the functional block the given interface arc fits, it is called "incoming", "outgoing" or "controlling".
It should be noted that any functional block, according to the requirements of the standard, must have at least one control interface arc and one outgoing arc. This is understandable - each process must occur according to some rules (displayed by the control arc) and must produce some result (outgoing arc), otherwise its consideration does not make any sense.
The mandatory presence of control interface arcs is one of the main differences between the IDEF0 standard and other methodologies of the DFD (Data Flow Diagram) and WFD (Work Flow Diagram) classes.
Decomposition( Decomposition ) is the core concept of the IDEF0 standard. The principle of decomposition is applied when a complex process is broken down into its component functions. Wherein level of detail process is determined directly by the developer of the model.
Decomposition allows you to gradually and structuredly represent the system model in the form hierarchical structure individual diagrams, making it less cluttered and easier to digest.
The last of the IDEF0 concepts is glossary. For each of the elements of IDEF0 - diagrams, function blocks, interface arcs - the existing standard implies the creation and maintenance of a set of appropriate definitions, keywords, narrative statements, etc., which characterize the object displayed by this element. This set is called a glossary and is a description of the essence of this element. The glossary harmoniously complements the visual graphic language, providing the diagrams with the necessary additional information.
The IDEF0 model always begins with a view of the system as a whole - a single functional unit with interface arcs extending beyond the considered area. Such a diagram with one functional block is called context diagram.
In the explanatory text for context diagram must be specified goal(Purpose) constructing a diagram in the form short description and fixed point of view(viewpoint).
Defining and formalizing the goal of developing an IDEF0 model is extremely important point. In fact, the goal determines the relevant areas in the system under study, which need to be focused first.
The point of view determines the main direction of the development of the model and the level of detail required.. A clear fixation of the point of view allows you to unload the model, abandoning the detail and research individual elements, which are not necessary, based on the chosen point of view on the system. Right choice point of view significantly reduces the time spent on building the final model.
Separation of subprocesses. In the process of decomposition, the functional block, which in context diagram displays the system as a whole, is detailed in another diagram. The resulting second level diagram contains function blocks that display the main subfunctions of the function block. context diagram, and is called a child (Child Diagram) in relation to it (each of the functional blocks belonging to the child diagram is respectively called a child block - Child Box). In turn, the functional block - the ancestor is called the parent block in relation to the child diagram (Parent Box), and the diagram to which it belongs is called the parent diagram (Parent Diagram). Each of the subfunctions of the child diagram can be further detailed by a similar decomposition of its corresponding functional block. In each case of decomposition of a functional block, all interface arcs entering the given block or outgoing from it are fixed on the child diagram. This achieves the structural integrity of the IDEF0 model.
Sometimes separate interface arcs top level it does not make sense to continue to consider on lower level diagrams, or vice versa - to reflect individual lower arcs on higher level diagrams - this will only overload the diagrams and make them difficult to read. To solve such problems, the IDEF0 standard provides for the concept of tunneling. The designation "tunnel" (Arrow Tunnel) in the form of two parentheses around the beginning of the interface arc means that this arc was not inherited from the functional parent block and appeared (from the "tunnel") only on this diagram. In turn, the same designation around the end (arrow) of the interface arc in the immediate vicinity of the receiving block means that this arc will not be displayed and considered in the child diagram of this block. Most often, it happens that individual objects and their corresponding interface arcs are not considered at some intermediate levels of the hierarchy - in this case, they first "plunge into the tunnel", and then, if necessary, "return from the tunnel".
- Creation of a model by a group of specialists related to various areas of the enterprise. This group is called Authors in IDEF0 terms. The construction of the initial model is a dynamic process during which the authors ask competent persons about the structure various processes, creating models of activity of divisions. They are interested in answers to the following questions:
What enters the unit "at the entrance"?
- What functions and in what sequence are performed within the unit?
- Who is responsible for performing each of the functions?
- What guides the performer in the performance of each of the functions?
- What is the result of the unit's work (output)?
Based on the existing provisions, documents and survey results, a draft (Model Draft) of the model is created.
- Distribution of the draft for consideration, approvals and comments. At this stage, the draft model is discussed with a wide range of competent persons (in terms of IDEF0 - readers) in the enterprise. At the same time, each of the diagrams of the draft model is criticized and commented in writing, and then transferred to the author. The author, in turn, also agrees with the criticism in writing or rejects it with a statement of the logic of the decision and again returns the corrected draft for further consideration. This cycle continues until authors and readers reach a consensus.
- Model approval. The approved model is approved by the head working group in the event that the authors of the model and readers have no disagreements about its adequacy. The final model is a consistent view of the enterprise (system) with given point vision and for a given purpose.
The visibility of the IDEF0 graphic language makes the model quite readable for people who did not take part in the project of its creation, as well as effective for demonstrations and presentations. In the future, on the basis of the constructed model, new projects can be organized aimed at making changes to the model.
IDEF0 is by far the main standard for business process modeling. Describing a system using IDEF0 is called functional model . The model describes what happens in the system, how it is managed, what entities it transforms, what means it uses to perform its functions, and what it produces.
When building a model, one must set the purpose of the simulation, answering the following questions:
Why should this process be modelled?
What should the model show?
What can the reader get?
Examples of goal definition: "identify and define current problems, enable analysis of potential improvements", "identify the roles and responsibilities of employees for writing job descriptions", "determine the possibility of automation ...", "regulate the process ...", etc.
Point of view is also one of the key elements in building a model. The point of view can be represented as the view of a person who sees the system in the aspect necessary for modeling. The point of view must be consistent with the purpose of the simulation.
The main conceptual principle of the IDEF methodology is the representation of any system under study as a set of interacting and interconnected blocks that display processes, operations, and actions occurring in the system under study. In IDEF0, everything that happens in the system and its elements is called functions. Each function is associated block.
Functional blocks in the diagrams are represented by boxes representing named processes, functions, activities or operations that take place over a certain period of time and have recognizable results. Inside each block is placed its name and number. The block name must be an active verb, a verbal phrase, or a verbal noun denoting an action.
Blocks in IDEF0 are placed in order of importance, as understood by the author of the diagram. This relative order is called dominance. Dominance is understood as the influence that one block has on other blocks of the diagram. The most dominant box is usually placed in the upper left corner of the diagram, while the least dominant box is placed in the right corner.
The interfaces through which the block interacts with other blocks or with the environment external to the system being modeled are represented by arrows, entering or leaving the block. Each side of the function block has standard value in terms of the block/arrow connection. Standard Location the shooter is shown in Fig.1.
Rice. 1. IDEF0 context.
Arrows describe the interaction of blocks with outside world and among themselves. The arrows represent some information and are called nouns or noun phrases.
IDEF0 distinguishes five types of arrows:
1. Input - material or information that is used or transformed by a functional block to obtain a result (output). It is allowed that the work may not have any entry arrow.
2. Governance - the rules, policies, procedures or standards that govern the unit. The control affects the block, but is not transformed by it.
3. Output - material or information that is produced by the block. A block without a result is meaningless and should not be modeled.
4. Mechanism - resources that perform the block, for example, enterprise personnel, machines, devices, etc. At the discretion of the analyst, the arrows of the mechanism may not be displayed in the model.
5. Call (Call) - a special arrow pointing to a different work model. The call arrow is used to indicate that some work is being done outside of the simulated system.
The arrows on the context diagram are used to describe the interaction of the system with the outside world. Boundary Arrows- arrows that start at the border of the diagram and end at the job or vice versa. Internal Arrows link the blocks together. There are five types of work links.
1. Connection by input - the arrow of the output of the higher block is directed to the input of the lower one (Fig. 2).
Rice. 2. The "output-input" relation.
2. Communication by control - the output of the higher block is sent to the control of the lower one (Fig. 3).
Rice. 3. Relationship "output-control".
3. Control feedback - the output of the lower block is sent to the control of the higher one (Fig. 4).
Rice. 4. Control feedback
4. Feedback on the input - the output of the lower block is sent to the input of the higher one (Fig. 5).
Rice. 5. Input feedback ratio
5. Output-mechanism connection - the output of one block is directed to the mechanism of another (Fig. 6).
Rice. 6 Connection "exit-mechanism".
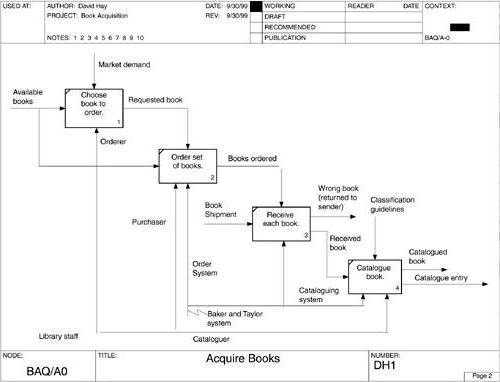
In the IDEF0 notation, the description of the system (model) is organized in the form of hierarchically ordered and interconnected diagrams. First, a description of the system as a whole and its interaction with the outside world is carried out (context diagram). The context diagram includes only one block that characterizes the entire set of simulated processes, without details.
Rice. 7 IDEF0 context diagram example.
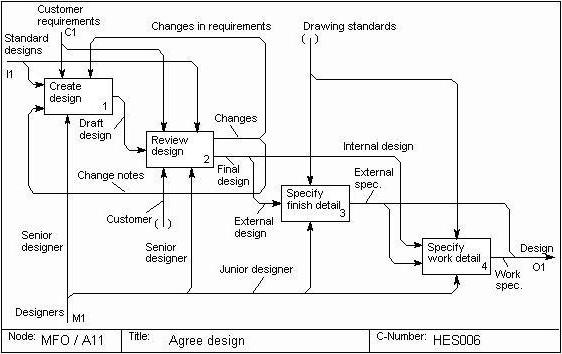
After that, a functional decomposition is carried out (Fig. 8) - this block of activities ( big process) is subdivided into large sub-processes - and each sub-process is described separately (decomposition diagrams). Then each sub-process is decomposed into smaller ones - and so on until the required description is detailed.
Fig.8 An example of an IDEF0 decomposition diagram.
IDEF0 diagrams are built using the BPWin program. They are intended for graphical modeling of ongoing business processes.
About the IDEF0 methodology
The IDEF0 methodology is widely used due to its simple and easy-to-understand graphical notation, the use of which is very convenient for building a model. The main place in the methodology is given to diagrams. The diagrams display the functions of the system using geometric rectangles, as well as the existing connections between the functions and the external environment. Links are displayed with arrows. You can verify this by seeing what the IDEF0 diagram suggests, examples of which can be found in this article.
The fact that only two graphical primitives are used in the simulation makes it possible to quickly explain the current IDEF0 interaction rules to people who have no idea about it. Through the IDEF0 diagrams, the customer's connection to ongoing processes is carried out more quickly through the use of a visual graphic language. You can see what the IDEF0 diagram suggests, examples of which are shown below.

Elements used for IDEF0
As already mentioned, 2 types of geometric primitives are used: rectangles and arrows. Rectangles represent certain processes, functions, work or tasks that have goals and lead to a designated result. The interaction of processes between themselves and the environment is indicated by arrows. IDEF0 distinguishes 5 various types shooter.

Possibilities of using IDEF0
The IDEF0 methodology can be applied to describe the functional aspect of any information system.
Types of links between IDEF0 processes
It is in the interests of the model to create such links of constructions so that the internal links are as strong as possible, and the external ones are as weak as possible. This is forte modeling with IDEF0. You can see examples of diagrams for yourself and verify the veracity of these words. To facilitate the establishment of links, similar ones are combined into modules. External links are established between modules, and internal links are established within modules. There are several types of connections.
1. Hierarchical ("part" - "whole") connection.
2. Manager (regulatory, subordinate):
2) Feedback management.
3. Functional or technological:
2) reverse input.
3) consumer;
4) logical;
5) methodical or collegial;
6) resource;
7) informational;
8) temporary;
9) random.
Building blocks and links in diagrams
The IDEF0 methodology provides whole line rules and recommendations for their use and improvement of the quality of use. So, the diagram displays one block, on which you can set the name of the system, its purpose. 2-5 arrows lead to the block or from the block. It can be more or less, but at least two arrows are needed for entry / exit, and the rest for additional work and their indications on the diagram. If there are more than 5 arrows, you should think about the optimality of building a model, and whether it is possible to make it even more detailed.

Building Blocks in Decomposition Diagrams
The number of blocks that will be on one diagram is recommended in the amount of 3-6. If there are fewer of them, then such diagrams are unlikely to carry a semantic load. If the number of blocks is huge, then it will be very difficult to read such a diagram, given the presence of additional arrows. To improve the perception of information, it is recommended to place blocks from top to bottom and from left to right. This arrangement will reflect the logic of the execution of the sequence of processes. And also the arrows will create less confusion, having a minimum number of intersections with each other.
If the launch of a certain function is not controlled in any way, and the process can be launched at an arbitrary moment, then this situation is indicated by the absence of arrows indicating control and entry. But the presence of such a situation can tell potential partners about a certain instability and the need to take a closer look at a potential partner.
A block that has only an entry arrow indicates that the process is receiving input parameters, but control and adjustment during execution does not occur. A block that has only a control arrow is used to designate jobs that are called only by special order. control system. They are managed and corrected at all their stages.
But the IDEF0 diagram example can convince you that the most complete and inclusive type is the entry and control arrow diagram.
naming
To improve visual perception, each block and each arrow should have its own name, which will allow them to be identified among many other blocks and arrows. This is what diagram examples look like in IDEF0. The information system built with the help of them will allow you to understand all the shortcomings and complexities of the models.
Merging arrows is often used, and there are questions about their naming. However, merging is possible only if homogeneous data is transferred, so separate names are not needed, although they can be specified in the BPWin program. Also, if the arrows diverge, then they can be separately named in order to understand what is responsible for what.
If there is no name after the branch, then the name is considered exactly the same as it was before the branch. This may be the case if two blocks require the same information. The IDEF0 context diagram, an example of which can be found in this article, confirms these words.
Arrow Information
Arrows entering and leaving the same block when building a composition diagram must be displayed on it. Names geometric shapes, transferred to the diagram, must exactly repeat the information of the highest level. If two arrows are parallel with respect to the other's arcs (i.e. start on the edge of one process and both end on the same edge of another process), then perhaps to optimize the model they should be combined and a suitable name should be chosen, which is beautifully displayed in IDEF0 (example diagrams in Visio can be viewed).
An example of the implementation of the IDEF0 methodology on a specific model
You have already learned what an IDEF0 diagram is, you have partially seen examples and rules for constructing such diagrams. Now we should turn to practice. For a better understanding, the explanation will not be based on some “general” model, but on a specific example, which will allow you to better and more fully understand the features of working with IDEF0 in the BPWin program.
As an example, the speed of a train from point A to point B will be taken into account. It must be taken into account that the train cannot develop a speed greater than that taken as permissible. This limit is established on the basis of operating experience and the influence of trains on the track. It should be understood that the purpose of the train is to deliver passengers who, in turn, have paid in order to safely and comfortably reach their destination. An IDEF0 diagram is useful, examples of which can be found in this article.

The initial information is:
- data about the track line;
- passport of the entire distance;
- path plan.
Control data:
- Indication of the chief, head of the track service.
- Information about the existing flow of movement of trains.
- Information about planned repairs, reconstructions and track changes.
The output of the model is:
- Restriction of permissible speeds indicating the reason for the restriction.
- Permissible speeds when driving at separate points and during the haul of trains.
Once a context diagram has been built, it must be drilled down and then a composite diagram created, which will be the first level diagram. It will show all the main functions of the system. The methodology and IDEF0 diagram for which the decomposition is done is called the parent. An IDEF0 decomposition is called a child decomposition.
Conclusion
After decomposition at the first level, decomposition of the second level is carried out - and so on until further decomposition loses its meaning. All this is done to obtain the most detailed graphic scheme current and planned processes. This is finished example IDEF0 diagrams that you can navigate right now.
Methodology functional modeling IDEF0 is a technique for describing a system as a whole as a set of interdependent actions or functions. It is important to note its functional orientation, i.e. IDEF0-functions of the system are investigated independently of the objects that provide their implementation. The "functional" point of view makes it possible to clearly separate the aspects of the purpose of the system from the aspects of its physical implementation. An example of an IDEF0 diagram is shown in fig. 3.6.19 a, 3.6.19 b, 3.6.19 c, 3.6.19 d.
Most often, IDEF0 is used as a system research and design technology. at the logical level. For this reason, IDEF0 is typically used in the early stages of project development, prior to IDEF3 modeling, to collect data and model the process "as is". The results of the IDEF0 analysis can be used in designing using IDEF3 models and DFD data flow diagrams.
The first step in building an IDEF0 model is to define purpose or purpose model - a set of questions that the model must answer. A set of questions can be compared to a preface that reveals the purpose of a book.
Simulation boundaries are intended to indicate the breadth of coverage of the subject area and the depth of detail and are a logical continuation of the already defined purpose of the model. Both the reader of the model and its author must understand the degree of detail of the answers to the questions posed in the purpose of the model.
The next step is to indicate the expected the target audience, for which the model is being created. Often from choice target audience depends on the level of detail with which the model should be created. Before building a model, it is necessary to have an idea of what information about the subject of modeling is already known, what additional materials and (or) technical documentation the target audience may need to understand the model, what language and style of presentation are most appropriate.
Under point of view refers to the perspective from which the system was observed when the model was built. The point of view is chosen in such a way as to take into account the already indicated boundaries of modeling and the purpose of the model. Once chosen, the point of view remains unchanged for all elements of the model. If necessary, other models can be created that display the system from other points of view. Examples of goals, boundaries, and viewpoints are shown in fig. 3.6.19a.
The IDEF0 graphic language syntax includes blocks, arrows, diagrams, and rules.
Blocks represent functions defined as an activity, process, operation, action, or transformation (see below). Arrows represent data or material objects associated with functions. The rules define how the components should be applied; diagrams provide a format for graphical and verbal description of models. The format forms the basis for model configuration management.
The block is a rectangle inside which its name and number are placed. The name must be an active verb or a verb phrase describing a function. The block number is placed in the lower right corner. Block numbers are used to identify them on the diagram and in the corresponding text. An example of a block is shown in fig. 3.6.20.
Rice. 3.6.20. Block example
Since the IDEF0 models model the system as a set of hierarchically nested functions, the function that describes the system as a whole must first be defined - context function. In IDEF0, this context function is represented as a single rectangle. An example of such a context function is shown in Figure 3.6.19a.
Any block can be decomposed to its constituent blocks. Decomposition is often associated with top-down modeling, but this is not entirely true. Functional decomposition is more correctly defined as “outside-in” modeling, at which we consider a system like an onion, from which layers are sequentially removed.
The description of any block must at least include a description of the objects that the block creates as a result of its work ("output") and the objects that the block consumes or transforms ("input").
Fig.3.6.19a. An example of such a context function
Rice. 3.6.19 b. IDEF0 Diagram Example
Rice. 3.6.19 c. IDEF0 Diagram Example
Rice. 3.6.19 IDEF0 Diagram Example
IDEF0 also models control and execution mechanisms. Control refers to objects that affect the way a block transforms an input into an output. Execution engine - objects that directly perform the transformation of input to output, but remain unchanged.
I (Input) - input - what is consumed during the execution of the process;
C (Control) - control - restrictions and instructions that affect the progress of the process;
O (Output) - output - what is the result of the process;
M (Mechanism) - the executing mechanism - that which is used to execute the process, but remains unchanged.
On fig. Figure 3.6.21 shows four possible types of arrows in IDEF0, each of which connects to a specific side of the function block.
Rice. 3.6.21. Each arrow type connects to a specific side of the function block
For the names of the arrows, as a rule, nouns are used. As with function blocks, naming all arrows in a diagram is necessary condition to understand the essence of the image. Examples of arrow names are shown in fig. 3.6.19 a, 3.6.19 b, 3.6.19 c, 3.6.19 d.
Let's give a detailed purpose of each arrow.
Entry arrows.Entrance, represents the raw material or information consumed or converted by a functional unit for production exit. The entry arrows always point to the left side of the rectangle that represents a function block in IDEF0. The presence of input arrows in the diagram is optional, since it is possible that some blocks do not transform or change anything. An example of a block that does not have an input is a management decision, where several factors are analyzed, but none of them is directly transformed and consumed as a result of any decision.
Control arrows. The control arrows are responsible for controlling how and when the function block is executed. Since the control controls the behavior of the function block to ensure that the desired output is generated, Each functional block must have at least one control arrow. Control Arrows always enter the functional block from above.
Governance often exists in the form of rules, regulations, laws, policies, a set of required procedures, or standards. Influencing the operation of the block, it itself remains unchanged. It may turn out that the purpose of a functional block is just to change one or another rule, instruction, standard, etc. In this case, the arrow containing the corresponding information should not be considered as a control, but as an input to the function block.
Management can be thought of as a specific kind of input. In cases where it is not clear whether to refer the arrow to the input or to the control, it is preferable to refer it to the control until the ambiguity is resolved.
exit arrows. An output is a product or information resulting from the operation of a function block. Each block must have at least one output. An action that does not have any clearly defined output is desirable not to be modeled at all, or is one of the first candidates for exclusion from the model.
When modeling non-production subject areas outputs are typically data processed in some form by a function block. In this case, it is important that the names of the entry and exit arrows are sufficiently distinguishable in their meaning. For example, a "Patient Admission" block might have a "Patient Details" arrow as both an input and an output. In such a situation, the incoming arrow could be called "Preliminary Patient Data" and the outgoing arrow "Confirmed Patient Data".
Execution mechanism arrows. Gears are a resource A that directly performs the simulated action. With the help of execution mechanisms can be modeled: key personnel, machinery and/or equipment. Execution mechanism arrows may be omitted if it turns out that they are not necessary to achieve the stated goal of the simulation.
Combined Arrows. There are five main types of combined arrows in IDEF0: 1) exit-input, 2) exit-control, 3) exit-execution mechanism, 4) exit-control feedback, and 5) exit - feedback on the input.
1) Arrow exit - entry is used when one of the blocks must complete its work before the start of another block. So, in fig. 3.6.22 the formation of an invoice must precede the acceptance of an order.
Rice. 3.6.22. Combination of arrows exit - entrance
2) Arrow exit - control reflects the situation of the predominance of one block over another, when one block controls the work of another. On fig. 3.6.23 The principles of forming an investment portfolio affect the behavior of brokers on the stock exchange.
Rice. 3.6.23. Combined arrow exit - control
3) Arrows exit - execution mechanism are less common and reflect the situation when the output of one function block is used as a tool for the operation of another block. On fig. 3.6.24 The clamp used to hold the part must be assembled in order to assemble the part.
4) Input and control feedbacks are used in cases where dependent blocks form feedbacks for the blocks that control them. On fig. 3.6.25 Information received from brokers about current exchange rates is used to adjust the strategy of playing on the stock exchange.
Rice. 3.6.24. Combined Arrow Exit - Execution Mechanism
Rice. 3.6.25. Combined arrow output - feedback to control
5) Arrow exit - feedback to the input is usually used to describe the cycles of re-processing something (Fig. 3.6.26). In addition, output-feedback links to input can be applied if defective products can be reused as raw materials, as happens, for example, in the window glass manufacturing process, when broken glass is ground and remelted along with the original raw materials.
Rice. 3.6.26. Combined arrow output - feedback to input
Splitting and joining arrows. The function block output can be used in several other blocks. In fact, almost the main value of IDEF0 lies in the fact that this methodology helps to identify the interdependencies between the blocks of the system. Accordingly, IDEF0 provides for both disconnection and connection of arrows in the diagram. Arrows split into several parts may have names that differ from the name of the original arrow. The original and disconnected (or combined) arrows are collectively called related. This technique is usually used to reflect the use in the process of only part of the raw materials or information indicated by the original arrow (Fig. 3.6.27). A similar approach applies to merged arrows.
Fig.3.6.27. Broken in two and renamed arrow
IDEF0 diagrams also have arrows of the form (¯). Such arrows are called tunnels. They are associated with the concept linked arrows, which is used to control the level of detail of charts. On fig. 3.6.28, for example, the "enterprise information system" arrow is an important execution mechanism for this diagram, but it may not be used anywhere else in the model. The tunnel in this case is used as an alternative to cluttering the parent diagrams by placing arrows that are irrelevant to their level.
Rice. 3.6.28. Tunnel application example
In addition, tunnels are used to reflect the situation when an arrow present on the parent diagram is not present in the decomposition diagram of the corresponding block. On fig. 3.6.29 the tunnel at the arrow "module of the production department" means that there is no arrow of the control mechanism with the corresponding name on the decomposition diagram of the production department.
A fully compiled IDEF0 diagram of any level contains in its margins service information, which consists of well-defined upper and footer(header and footer). Header elements are used to track the progress of the model creation. Footer elements display the name of the model to which the diagram belongs and show its location relative to other diagrams in the model.
All elements of the chart title are listed in Table. 3.1.6.
Rice. 3.6.29. Tunnel application example
Table 3.1.6. IDEF0 Chart Title Elements
| Field | Purpose |
| USED AT | Used to reflect external links on the this chart(filled in on the printed document manually) |
| Author, date, project | Contains the name of the author of the diagram, the date of creation, the date of the last modification, the name of the project within which it was created |
| Notes 1 ... 10 | When manually editing charts, users can cross out a number every time they make a correction. |
| Status | The status reflects the state of development or approval of a given diagram. This field is used to implement the formal publishing process with review and approval steps. |
| Working | New diagram, global changes, or new author for an existing diagram |
| Draft | The chart has reached some reader-friendly level and is ready for submission for approval |
| Recommended | The diagram is approved and approved. No changes are expected |
| publication | Diagram ready for final print and publication |
| reader | Reader name |
| Date | Date the reader was introduced to the chart |
| Context | A sketch of the location of functional blocks on the parent diagram, on which the block decomposed by this diagram is highlighted. For the top level chart ( context diagram) the TOP context is placed in the field |
All elements of the "basement" of the diagram are listed in Table. 3.1.7.
Table 3.1.7. IDEF0 Chart Footer Elements
| Field | Purpose |
| node | Diagram number that is the same as the parent function block number |
| Title | Parent function block name |
| Number (also called C-Number) | The unique identifier for this version of this chart. Thus, each a new version of this chart will have a new value in this field. Typically, the C-Number consists of the author's initials (which are assumed to be unique among all project analysts) and a consistent unique identifier, such as SDO005. When published, these numbers may be replaced by standard page numbers. If a diagram replaces another diagram, the replacement diagram number can be enclosed in brackets - SDO005 (SDO004). This provides a history of changes to all diagrams in the model. |
As a rule, the author prepares his own set of diagrams for each reviewer. Suggestions for changes and corrections are returned by reviewers to the author for inclusion in the model. When disagreements arise between the author and the reviewer, the disputed diagram is usually sent to all reviewers to reach a group consensus.
Formally, the mechanism for reviewing and modifying diagrams is supported by the Status fields and diagram numbering, the control of the history of changes is supported by the Field field (see Table 3.1.6).
No model should be built without a clear understanding of the object and goals of modeling. The chosen definition of the modeling goal should answer the following questions:
Why is modeled this process?
What will reveal this model?
How can people familiar with this model apply it? The following sentence can serve as an example of the formulation of the modeling goal. Identify the tasks of each employee of the company and understand the overall relationship between individual tasks in order to develop a guide for training new employees.
Models are built to answer a set of questions. Such questions are formulated early in the simulation and subsequently serve as the basis for a clear and concise definition of the purpose of the simulation. Examples of such questions might be:
What are the tasks of a manager?
What are the tasks of a clerk?
Who controls the work?
What technology is needed to complete each step? etc.
In order to get to know the IDEF0 standard better, you need to know the following about it:
- To build what types of models this standard used.
- What elements of the graphic language are included in the notation of the standard, and what requirements for the design of diagrams exist within the framework of the standard.
- What business process modeling principles are used in the standard (decomposition principle, complexity limitation principle, tunneling principle).
- How can you evaluate the constructed diagrams in terms of their congestion and balance.
IDEF0 used to create functional model , reflecting the structure and functions of the system, as well as the flows of information and material objects transformed by these functions.
The IDEF0 methodology differs slightly from the classic DFD business process description scheme. The main difference is the classification of work inputs.
Classification of inputs and outputs of work
The standard proposes the following typification of work inputs:
- Entrance. Enters the work on the left and shows the information and material flows that are transformed in the business process.
- Control. Enters the work from above and shows the material and information flows that are not transformed in the process, but are needed for its implementation.
- Mechanism. Enters the work from below and shows people technical means, Information Systems etc., with the help of which the business process is implemented.
- results exit the block on the right.
The main elements of the diagram:
The basis of the IDEF0 graphical language, whose syntax and semantics are defined with absolute rigor, are blocks and arrows connecting them, which form a hierarchy of detailed diagrams.
| Element | Graphic display and meaning |
Design Requirements |
| Functional block |
Shown as a rectangle. Represent functions defined as an activity, process, operation, action, or transformation. |
1. Must have a unique identification number in the lower right corner; 2. The name must be in the verbal mood. |
| interfacearc (arrow, arc) |
Shown as a unidirectional arrow. Represent data or material objects associated with functions. |
1. Must have a unique name. 2. The name must be a turnover of a noun. 3. The beginning and end of the arc can only be function blocks. 4. The source can only be the output side of the block, and the receiver can be any of the three remaining. |
IDEF0 - model:
The model includes the following documents, which reference each other:
- Graphic charts- the main component of the IDEF0 model, which graphically, using blocks and arrows and their connections, displays information about the system being modeled. Blocks represent basic functions. These functions can be broken down (decomposed) into their component parts and presented as more detailed diagrams. The decomposition process continues until the object is described at the level of detail necessary to achieve the goals of a particular project.
- Text;
- Glossary- For each element of the diagram, a set of definitions, keywords, explanations is created and maintained that characterizes the object that this element represents. This set is called a glossary and is a description of the essence of this element. The glossary harmoniously complements the visual graphic language, providing the diagrams with the necessary additional information.
The principle of decomposition when building a business process model
1. Context diagram: purpose and point of view
Business process modeling starts with a context diagram. This chart is called A-0 (A minus zero). On it, the system is represented as a single block and arcs depicting the environment of the system. Using the diagram, you can see the interaction of the simulated system with the external environment, all its inputs and outputs. Diagram A-0 establishes the modeling area and boundaries.
 The explanatory text for the context diagram should indicate goal charting and fixed point of view. The point of view determines the level of detail, the direction of development of the model and allows you to unload the model. So, when modeling, you can refuse to detail and study individual elements that are not necessary, based on the chosen point of view on the system.
2. Detailing
The block that represents the entire system is then detailed in another diagram.
Further, each function of the diagram can be detailed on the child. Each function is modeled by a separate block. Each parent box is described in detail by a child diagram at a lower level. This happens until a structure is obtained that allows answering the questions formulated in the modeling goal.

To achieve the structural integrity of the model, the following rules are used:
- All interface arcs included in this block or outgoing from it are fixed on the child diagram.
- When numbering blocks, the number in the lower right corner of the rectangle indicates the unique serial number of the block itself on the diagram, and the designation at the right angle indicates the number of the child diagram for this block.
Tunneling principle
Often there are cases when it does not make sense to continue to consider individual arrows in child diagrams below a certain level in the hierarchy, or vice versa - individual blocks do not make practical sense above a certain level. On the other hand, sometimes there is a need to get rid of individual “conceptual” arrows and not detail them deeper than a certain level.
To solve such problems, the IDEF0 standard provides for the concept tunneling. The designation of a “tunnel” in the form of two parentheses around the beginning of the arrow means that this arrow was not inherited from the functional parent block and appeared (from the “tunnel”) only on this diagram. In turn, the same designation around the end of the arrow in the immediate vicinity of the receiver block means the fact that this arrow will not be displayed and will not be considered in the child diagram of this block.
The principle of limiting complexity
In order to limit the overload of models and make them easy to understand, the standard adopts the appropriate complexity restrictions:
- limiting the number of functional blocks in the diagram to three to six. The upper limit (six) forces the designer to use hierarchies when describing complex subjects, and the lower limit (three) ensures that the corresponding diagram has enough detail to justify its creation;
- limiting the number of interface arcs approaching one functional block (leaving one functional block) to four.
Of course, it is not at all necessary to strictly follow these restrictions, however, as experience shows, they are very practical in real work.
Quantitative Chart Analysis: Balance Ratio and Name Evaluation
Quantitative analysis is used to analyze the diagram in terms of its congestion and complexity for perception. The following indicators are used for the analysis:
- the number of blocks on the diagram — N;
- diagram decomposition level − L;
- chart balance - AT;
- the number of arrows connected to the block, - BUT.
balance factor
It is necessary to strive to ensure that the number of blocks on the diagrams of the lower levels would be lower than the number of blocks on the parent diagrams.
The charts also need to be balanced. This means that within one diagram there should not be a situation where there are significantly more incoming arrows and control arrows than outgoing ones.
It should be noted that this recommendation may not be performed in models describing production processes. For example, when describing an assembly procedure, a block can include many arrows describing the components of a product, and one arrow can exit - the finished product.
Let's introduce the chart balance factor:

It is necessary to strive to ky was minimal for the diagram and decreased with increasing decomposition level.
Name evaluation
In addition to the analysis of the graphic elements of the diagram, it is necessary to consider the names of the blocks. To evaluate the names, a dictionary of elementary (trivial) functions of the simulated system is compiled. In fact, the functions of the lower, level decomposition of diagrams should fall into this dictionary.
For example, for a database model, the functions “find a record”, “add a record to the database” may be elementary, while the function “user registration” requires further description.
After forming the vocabulary and compiling a package of system diagrams, it is necessary to consider the lower level of the model. If it shows a match between the names of blocks of diagrams and words from the dictionary, then this indicates that a sufficient level of decomposition has been achieved.
Coefficient, quantitatively reflecting this criterion, can be written as:
L*C
— the product of the model level by the number of matches of block names with words from the dictionary. The lower the level of the model (higher L), the more valuable the matches.