Create calculated fields in a report. How to create a calculated field in excel Inserting a graphical object into a form
It is known that in the database Microsoft Access calculated fields can be created in a query, form, or report. Consider creating calculated fields in a database report Access data 2003. To enter an Expression in a form, open it in Design mode and create a free text field using the " ab" (Field) on the toolbar. To the left of the created free field, there is a label associated with the text field, which displays the ordinal number of the entered field.
A free field means that it is not associated with any field. In a free field, you can enter a database table field or an Expression. The label is used to enter the name of the field. When you enter in the free field "Expressions", which calculates the required value, it becomes calculated. You can use functions in calculated fields, such as the date or time function, or you can enter an expression that takes the values of fields in an Access database table as input. You can also insert a stand-alone text label on the form, i.e. label not associated with the text field, for this you need to use the button " aa" (Label) on the toolbar.
Consider creating a calculated field in the Students form using the Training_students_VP database as an example. Statement of the problem: in the Access DB form Students_constructor, create one field in which the current date should be displayed, and another field that combines the student's last name, first name and patronymic. To solve this problem, let's open the Students_Constructor form in the design mode (Fig. 1).
Rice. one.
To create a calculated field in an Access DB form that displays the current date, you must perform the following operations:
- press the button " ab" (Field) on the toolbar, and then click on the form at the place where you plan to insert a free text field;
- then place the cursor in the "Free" field (Fig. 2) and enter the function: =Date();
- the next step is to change the name of the text field label (Fig. 2), to do this, remove the serial number (in our example, Field 30) and enter the word " Date:";

Rice. 2.
- change the length of the label and text box to fit the content;
- format the calculated field (if necessary), to do this, right-click on the calculated field and select the Properties command in the context menu, the "Field" dialog box will open. Formatting is carried out in the "Field" window on the "All" tab in the "Field Format" line (Fig. 3);

Rice. 3.
- close the Field window;
- view the Access database form in form mode by clicking the Open button (Fig. 4);

Rice. 4.
To create another calculated field in an Access DB form that displays an expression that uses the values of the table fields (Last Name, First Name, Middle Name) as input, you must perform the following steps:
- add a free field to the form (Figure 5);

Rice. 5.
- change the label name of the text field to full name;
- call the expression builder, to do this, click on the "Builder" icon on the toolbar, the Builder window will open, in which you need to select the "expression" (Figure 6) and click OK;
Before you can create a calculated field, you must open or generate a PivotTable. In our example, we use the pivot table shown in Fig. 5.6.
Now that we have a pivot table at our disposal, it's time to create a calculated field. To create a calculated field, activate the Insert Calculated Field dialog box.
To open it, on the contextual tab of the ribbon Options (Options), selected in the contextual tab group PivotTable Tools (PivotTable Tools), go to the group Calculations (Calculations), click on the button Fields, elements and sets (Fields, Items & Sets) and select the Calculated Field command from the drop-down menu, as shown in fig. 5.7.

The Insert Calculation Field dialog box will appear on the screen, as shown in Fig. 5.8.

At the top of the dialog box, there are two text boxes: Name (Name) and Formula (Formula). In these fields, you must specify the name of the calculated field and create a formula, specifying the required data fields and mathematical operators. On fig. Figure 5-9 shows that the calculated field has been given the descriptive name Average Revenue per Hour. This name must accurately describe the type of mathematical operation being performed.

Next, go to the Fields list and double-click on the Sales Volume field. Enter a forward slash / to indicate Excel program that you will be dividing the value of the Sales Volume field by another element.
By default, the Formula text box in the Insert Calculated Field dialog box contains the expression = 0. You must remove the zero before entering your own formula.
From now on, the dialog box should look like the one shown in Fig. 5.10.

Rice. 5.10. Start entering the formula with value = 'Sales volume'/
Finish entering the formula by double-clicking the Sales period (in hours) field. The finished formula is shown in fig. 5.11.

Figure 5.11. Full formula= 'Sales volume'/'Sales period (in hours)' displays the required calculated field
Click the Add button and then the OK button to activate the new calculated field. As seen in fig. 5.12, as a result, you will get a calculated field inside the pivot table.

Note that after creating a new field, Average revenue per hour, it is added to the list of fields.
The result obtained using a calculated field is not formatted. You can optionally format it using the technique described in Create a Basic PivotTable.
Does this mean that you have added a column to the data source? No. Calculated fields are similar to the default PivotTable Subtotal and Grand Total items in that they are all mathematical functions that recalculate data when the PivotTable is modified or updated. Calculated fields simply mimic strictly defined fields in the data source. You can drag and drop them, change field settings, and use them along with other calculated fields.
Take a close look at fig. 5.11. Note that the format of the formula you entered is similar to that used in the standard string Excel formulas. The obvious difference is that instead of using strict cell references or numeric values, you refer to the PivotTable data fields to define the arguments used in the calculations. If you have already worked with formulas in Excel, you will quickly grasp the concepts of creating calculated fields.
Additional | Result |
|
calculations | ||
Sort by | Sort Smallest to | |
minimum k | ||
maximum We report in a table format with three columns containing: product name, category and sale. Example In this example, we will continue to work on the PivotTable created in the example. PivotTable reports allow. Each exercise starts by creating your own working directory in the My Documents folder where you will save your files. Multiple sheet operations Multiple sheet operations at a time. Move and copy sheets between files. Laboratory 4 Page 1 of 17 Contents. The following table shows the 10 names of the employees of a particular company, their monthly pay, and the annual bonus they received. | field elements from the minimum (1st position) |
|
to the maximum value |
||
Sort by | Determining the sequence number of a value |
|
maximum k | element (rank) in relation to values We would like to sort by title. However, for regular user database systems require special training. Pivot Tables Sometimes it becomes necessary to summarize the contents of a database as an additional table. A table that summarizes selected database fields is called a pivot table. PivotTable PivotTables allow you to collect data contained in databases stored in workbooks or external files. Change the screen size or. Exercise 4 Tables and programs for calculating statistics. A spreadsheet is made up of cells formed from the intersection of rows, usually denoted cases, with columns, denoted. |
|
minimum | field elements from the maximum (1st position) |
|
to the minimum value |
||
Calculation of values by formula: |
||
Value_ in_ cell∙Total_total D: Creating Gantt charts. Its great advantage is the ability to automate. Spreadsheet used where there is a huge amount of labor that is repeated according to a certain pattern. This database consists of several tables, fig. The right side of the screen will appear. Introduction. A spreadsheet is usually thought of as a tool for performing simple or advanced calculations using built-in functions or. It belongs to a type of program called a spreadsheet. Tools are changing work time. In the calendar field, select the resource for which we want to change working hours, for example, enter a vacation or change working hours. |
||
row_total∙column_total |
2nd method: right-click on the values of the desired field in the Σ Values area and select:
Optionally, to select a different function from the suggested list, customize the field format, and change the field name.
To take advantage of the effects. Today we will teach you. Check the cells you want to draw. Lesson 3: Tables and PivotCharts. Suppose we have a set for analysis. To use a PivotTable, select any cell on the worksheet and select PivotTable from the Insert menu.
Then you can get information. When creating charts, it doesn't matter if the table has a border or other formatting. Introduction to Formulas and Functions Performing calculations, whether simple or complex, can be tedious and time consuming.
Additional Calculations, then select the desired calculation option.
Reusing an original field in a PivotTable report
Multiple calculations can be made on the same source field. To do this, you need to add the initial field from the list of fields of the pivot table to the range of values Σ Values [Σ
Values] several times, then adjust the field settings. This will allow you to simultaneously see both the calculation itself and the calculation performed on its basis.
Adding Calculated Fields to a PivotTable
You cannot add new rows or columns to a PivotTable report to insert formulas or additional calculations, but you can add a calculated field that you can use to enter formulas to calculate new data based on existing data.
Databases Worksheet 1 Databases Worksheet 1 Create a Databases folder to store all course data. Creates a query that displays titles and descriptions. The database management dialog box will appear. Using this window, the user manages the database and all its elements.
What is a spreadsheet? A spreadsheet is a program for performing mathematical calculations. With it, we can also make legible calculations in the form. To take advantage of specific actions. The hardest part is preparing the data. Problem 1 Math Group 2 Follow these steps in turn. Run the table.
Inserting a calculated field directly into a PivotTable is the best solution. You won't need to manage formulas or worry about table extensibility as you grow or edit your data source, and the PivotTable will remain flexible enough as field definitions change.
Another huge advantage of this method is that you can change the structure of the PivotTable and even calculate other data fields for calculated fields without worrying about formula errors or broken cell references.
West Pomeranian University of Technology in Szczecin Faculty of Marine Technology and Transportation Department of Structures, Mechanics and Technology A ship in an operational research laboratory. Pivot tables are used for quick data analysis. In order to use pivot tables, we must have the data properly prepared with headers.
To avoid such situations, you should format our data as a table. To format data as a table. This will select all headers. . next choice is the location of the pivot table, and to keep the data readable, you should leave the New Sheet option, which will insert a new sheet into the table.
Microsoft Excel 2010 Level 2 Advanced Features
Thus, when adding your own calculated fields to a pivot table, the advantages are obvious:
Avoid potential errors in formulas and cell references.
Ability to add and remove data from a PivotTable without changing the original calculations.
There is a new pivot table sheet that is empty. On the right side there is a list of fields, which contains all the headings from our table, and a plan with its areas. Suppose we want to see who was the best seller. In this case, select the Seller field and the Amount field, because after the sale we will check who was the best. The report will look like this.
The default is column. Pivot tables can be easily modified, and if you want to check the country where the best sales are made, just cancel the purchase and mark it as a seller. Immediately we get a new report from which you can read the result.
Ability to automatically recalculate data when changing or updating a pivot table.
Providing the flexibility to change calculations when element definitions change.
Possibility of effective management of calculations.
Create a calculated field:
1. Select a pivot table cell;
We can also add a subcategory to the Seller by checking this box. The sales report automatically summarizes the displayed values, but often these totals make analysis difficult. We can also get rid of the grand total and change the layout of the report.
To quickly change the report and see how he sold Dobrovalsky to other countries, simply change the order of the conditions in the margins by grabbing the Seller and dragging him through the state. Apart from Ireland and Germany, it is clear that its sales results are not the best. When you click on sell in Ireland, you will see a new sheet with a table containing all of Dobrovalsky's transactions in Ireland.
2. On the Options tab, in the Calculations group, expand the list of Fields,
elements and sets and select Calculated field.
3. In the window Insert a calculated field:
Enter a name for the new field in the Name field.
In the Formula field, write a formula, starting with the = sign and choosing
available fields in the Fields list (to insert, you can double-click on the field or select the field, then click the Add Field button).
If we want to print our data, we will take the Salesperson field from the "Lines" area and move it to the "Column" area. This will make the table spread across the entire sheet. In this window, we can also specify the number format displayed in all cells of the field. Just use the "Number Format" button and select the appropriate currency, eg.
Filters are also helpful. When added to this area, vendor fields appear in the upper left corner of a drop-down list from which you can select one or more options. Let's see which month was the best sale. Below we select the category according to which we want to group the data.
Click Add.
The appearance of a calculated field, like any other field, is configured in the window
Value field options.
Editing a calculated field
1. On the Options tab, in the Calculations group, open the Fields list,
elements and sets, select Calculated field.
We all know how to use pivot tables. They have a lot of advantages, but there are also a lot of disadvantages. Many people think that the main problem with pivot tables is that there is no way to do calculations in it - this is a misconception. Why might this be necessary. Let's say you're budgeting using pivot tables. The data in the original table is presented quarterly, for budgeting purposes it will be necessary to add these data to an annual amount.
We mark the months and we accept them. We will get a report sorted by month. You can also split the data into multiple categories. Returning to the grouping of configurators and selecting "Quarter and month", we will get the appearance of the report. Grouping can also be used for numbers.
When you open the context menu, the Rows field and the Group option show a different window than if you were grouping dates. The numbers are grouped into ranges, which we define by the beginning, end, and volume of the interval. In this case, we set it to 500, so the first group will contain all transactions with a value between 0 and 500 PLN.
In fact, there is such an opportunity and it is implemented in one of three ways.
Refresh your knowledge of the basics of pivot tables.
First way. Make calculations in the table with the source data. The method, frankly, is not a fountain - through the wrong place.
The second way. Build calculations in next to the pivot table - again, the method is not the best. If the pivot table will change (and it is worth using pivot tables exactly when we expect changes in the table).
The third way. Embed calculated fields in the PivotTable itself. But this is a good way. This is done in the following way. When the pivot table has already been built, put the cursor on the pivot table (two tabs related to this pivot table appear on the ribbon) and click on the tab that appears Options, then fields,Items , &Sets from the Calculations block, in the drop-down menu, select Calculatedfield. In 2007 office, this button was on the same Options tab, only the button was separate.

In the window that appears, in the field Name enter the desired field name. In field Formula enter the formula you need by inserting the fields from the list below and clicking the button Insertfield.
![]()
You will get a table with a new calculated field. The table is ready!

The Excel file can be downloaded from here.
Interesting fact. When using the third method, the program actually does the calculations for each row and then applies the necessary parameter: summation, average, and so on.
Last news
Advanced Excel: Why I Stopped Using Function V…
I already wrote about the fact that the VLOOKUP (VLOOKUP) function is probably the most useful feature after simple arithmetic operations …
How Excel recalculates a workbook and why you should avoid volatil...
If you often work with big files that produce a large number of calculations that depend on each other, about ...
How to quickly build a Waterfall chart (waterfall)
Excel does not have standard Waterfall charts. Therefore, to create diagrams of this type, gis is usually used ...
Benchmark window to track results
It often happens that we work with large tables that ultimately calculate 1-2 indicators, but depend on ...
Bullet chart for comparison of planned indicators and actual…
Often there is a need to compare the main financial and economic indicators with the planned ones, for example, for the purposes of…
Tatsuo Horiuchi is a 73-year-old artist who draws in Excel.
"I've never used Excel at work, but I've seen other people make some pretty nice charts and graphs in it...
How to raise a number to a power and take a root
Did you know that in order to raise a number to a power in Excel there is a special symbol ^ (on the six in English ...
V Microsoft SQL Server in tables, you can use columns with a calculated value, they are called "Computed Columns". Now I will tell you about why such columns are needed, what features they have and, of course, how to create them.
Calculated columns in tables
Calculated column is a virtual table column that is calculated based on an expression; other columns of the same table can participate in these expressions. Such columns are not physically stored, their values are calculated each time they are accessed. This is the default behavior, but you can make calculated columns physically stored by specifying keyword PERSISTED when creating such a column. In this case, the values given column will be updated when any changes are made to the columns included in the evaluated expression.
Calculated columns are needed in order to make it easier and more reliable to get the result of some constant calculations. For example, when accessing a table, you always use some formula in an SQL query ( you multiply one column with another or something like that, although the formula can be more complicated), and so, if you define a calculated column in the table, specifying the necessary formula in its definition, you will no longer need to write this formula in the SQL query in the SELECT statement every time. You just need to refer to a certain column ( calculated column), which automatically applies this formula when outputting values. However, this column can be used in queries just like a regular column, for example, in WHEHE sections ( in the condition) or in ORDER BY ( in sorting).
It is also important to understand that a calculated column cannot be specified as the target column in an INSERT or UPDATE statement.
Creating a calculated column when creating a new table in Microsoft SQL Server
Let's imagine that we need to create a table in which goods will be stored indicating their quantity and price, while we want to constantly know how much we have for this or that product, i.e. we need to multiply the quantity by the price. In order not to do this every time in the query, we create a calculated column, in the definition of which we indicate the corresponding formula. also in this example we will specify the PERSISTED keyword so that our column is physically stored and updated, i.e. recalculated only if the values in the quantity or price columns change.
--Create table with computed column CREATE TABLE TestTable ( IDENTITY(1,1) NOT NULL, (100) NOT NULL, NULL, NULL, AS ( * ) PERSISTED --Computed column) --Add data to table INSERT INTO TestTable VALUES ("Briefcase", 1, 500), ("Pencil", 5, 20), ("Notebook", 10, 50) --Data selection SELECT * FROM TestTableAdding a calculated column to an existing table in Microsoft SQL Server
And now let's assume that there is a need to know also the amount, taking into account a certain static coefficient (for example, 1.7). But we were told this after we created the table, in other words, we need to add a calculated column to an existing table.
Adding a calculated column to a table ALTER TABLE TestTable ADD SummaALL AS ( * * 1.7); --Fetch data SELECT * FROM TestTable

Adding calculated columns is also available in the graphical environment. To do this, you just need to find the desired table in the object browser and right-click on the container " columns» and select « Create column”, i.e. everything is as usual.

Then specify the column name and data type ( data type temporarily), and in order to define a calculated column, in " Column Properties» you need to find the section « Computed column specification" and in the field " Formula» indicate the appropriate formula.

The calculated column is defined in the same way when creating a table using Management Studio, i.e. the formula is simply indicated in the appropriate section.
Remove a calculated column from a table
If you no longer need a calculated column, you can delete it, this is done in the same way as deleting a regular column.
ALTER TABLE TestTable DROP COLUMN SummaALL;

This concludes my story about calculated columns in my book The T-SQL Programmer's Way. Transact-SQL Tutorial » I talk in detail about all the features of the T-SQL language, good luck!
Sometimes there is a need to present subtotals in the form, or to do any other calculations. For this purpose, you can create a calculated field in the form.
A calculated field can be present in both forms and reports. In this case, in the form it is created in the data area using the "Field" control. For this:
1. Open the form in which you will create the calculated field in Design view.
2. On the toolbar, select the Field element and place it in the desired location in the data area.
3. Align the field label and the field itself as you see fit.
4. By double-clicking the mouse button, enter the field label editing mode and enter the name of this field (the name of what the formula will calculate).
5. Click right button mouse, call the context menu for the field itself and select the Properties item.
6. Select the Data tab and use the expression builder in the Data field to enter the required formula, starting with an equal sign:
· Double clicking on the name of the form field (middle area of the builder) will place it in the created formula;
· Clicking on an arithmetic symbol will also allow you to place it in the formula you are creating.
7. Note: You can not use the expression builder to create a formula, but enter it in the editing mode of the "Data" part (where "Free" is indicated) of the selected field. In this case, the names of the fields of the tables are square brackets, and they must fully match the name specified when creating the table, respecting case and all characters, including spaces.
8. Save the created form and open it in form mode. If you find any errors, return to design mode.
Tasks
1. Create a field that calculates the cost of each shipment for Library Instances.
2. To do this, use the above sequence of actions and the following notes:
a calculated field must be created in the form "Supply subform";
Open this form in Design view.
select the field control;
Enter “Delivery cost” in the field caption, in the field the formula =[Price]*[Quantity] (where [Price] and [Quantity] are the names of the corresponding fields of the “Delivery” table, which are used in the form to display the necessary data).
3. Open the "Supply Subform" form and verify that the calculated field works correctly.
4. Open the Instance form, see if the newly created field is visible. If necessary, resize the subform so that all data is displayed.
5. Save the changes, show the result to the teacher.
Creating the main button form
The main button form is the form that is loaded first when the database is opened. This form should contain buttons, by pressing which you can have access (open, print, etc.) to all objects of your database: forms, queries, reports. In addition, it must have an exit button (as well as on each of the forms), or a button to return to the main form.
When creating the Main button form, you can use:
1) Constructor mode ();
2) Button form manager (Tools/Utilities/Button form manager menu).
To create a button form in Design view you need to follow the steps below.
1. Creating a "layout" form:
· On the Form tab, select the Create command;
· as the form creation mode, specify the Design Mode;
Do not specify the data source for the form (the newly created form has only a data area);
Save the form with the name "Main".
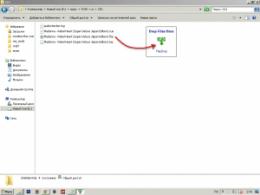
2. Insert graphic object in the form:
· on the Elements Palette, select the Picture control;
place it in the data area;
In the dialog box that appears, select graphic file(*.bmp) to insert it into the data area;
· You can change the properties of an object by calling the context menu for it and using the necessary commands.
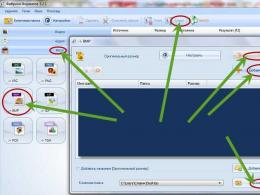
3. Creating a button:
· on the toolbar, select the button control;
· place it in the data area.
· choose from the list of categories necessary for you (for example, Working with a form);
· From the list of actions, select the one that you intend to carry out using this button (for example, Closing the form). Click "Next;
· select the most appropriate picture, in your opinion, it will be displayed on the button. If you want, you can select text as a designation for the function of the button you are creating. Click "Next.
Give a name to the newly created button. It is recommended to leave the numbering of the system (the default name is “Button N”, where N is the number in order).
· Click the Done button;
You can change the appearance and location of the newly created button using context menu and its respective commands;
· Open the form in form mode, check the operation of the button.
Tasks
1. Build the main button form for learning task, guided by the information in the paragraph "Creating the main button form" and the following requirements:
The form should contain a drawing corresponding to the topic of the educational task;
Every element of the created system must be accessible from separate tab: forms, reports, requests;
The form must have buttons for launching elements and closing the form;
buttons for launching queries and reports may be absent or exist in the form of "stubs", that is, buttons without an assigned action;
· on each of the previously created forms there should be buttons for closing the form and switching to the Main form (create the necessary buttons on the forms "Supplier" and "Instance" created by you: new entry, deleting the entry, closing the form and switching to the main one) (see Fig. 5, 6).
Note: buttons and other controls that allow you to work with other database objects will need to be added when performing subsequent laboratory work(11 and 12).
2. Save the Main Form.
3. Check her work.
4. Using the newly created forms, create one new record in each of the tables.
Questions for self-control
1. Why is the form used as an MS Access DBMS object?
2. What areas of the form do you know, what is the purpose of each of them?
3. What is the difference between the Tape method of data composition on the form ( appearance) from Tabular?
4. What is the difference between the data layout method on the "Pivot Table" form and the "Pivot Chart"?
5. What is the difference between the method of composing data on the form "In one column" from "Aligned"?
6. Is it possible to change the selected form style, if so, how to do it?
7. If you want to add a calculated field to the form, what control will you use and in what area of the form will you place it?
8. What part of the field control can and cannot be changed, and why?
9. What is the algorithm for creating a subform in Wizard mode?
11. Is it possible to use the names of other calculated fields of this form when writing a calculated expression (justify your answer)?
12. Determine the purpose of the main button form.
13. What is the sequence of actions when working with the Button Form Manager? State the advantages and disadvantages this mode?
14. Does the Form Designer mode allow you to create forms based on multiple tables or queries, and if so, how is this done?
15. What fields, when creating forms based on several tables, must be entered to ensure the correct operation of the corresponding tables.
LAB #11
Designing queries in MS Access DBMS
1. Designing a query for a selection.
2. Designing delete and update requests.
3. Designing a query with a parameter.
Target: learn how to construct select, delete, and parametric queries.
The query allows you to select the necessary data from one or more related tables, perform calculations and get the result in the form of a table. Through a query, you can update, add, and delete data in tables.
The query is built either on the basis of one or more database tables, or tables obtained as a result of other queries are used.
Sequential execution of a number of queries allows you to solve quite complex problems without resorting to programming. In MS Access, you can create several types of queries. As part of this laboratory, we will consider the features of working with select, delete, and update queries, as well as with parametric queries.