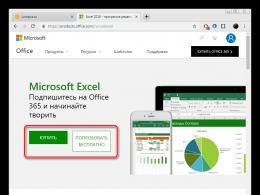
Microsoft excel description. Microsoft Office Excel - what is it? Tools for statistical data analysis
It is able to greatly facilitate the user's work with tables and numerical expressions by automating it. This can be achieved using the application's tools and its various functions. Let's look at the most useful of them.
Due to the wide functional purpose of the program, the user is not always aware of the features that simplify interaction with many Excel tools. Later in this article, we will talk about 10 best features, which can be useful for various purposes, as well as provide links to detailed tutorials on working with each of them.
VLOOKUP function
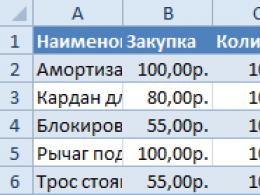
One of the most requested features in Microsoft Excel is "VLOOKUP". Using it, you can drag the values of one or more tables to another. In this case, the search is performed only in the first column of the table, thus, when the data in the source table changes, data is automatically generated in the derived table, in which separate calculations can be performed. For example, information from a table that contains price lists for goods can be used to calculate indicators in a table about the volume of purchases in monetary terms.
VLOOKUP is started by inserting a statement "VPR" from "Function Wizards" to the cell where the data should be displayed.
In the window that appears after running this function, you need to specify the address of the cell or range of cells from where the data will be pulled.

Pivot tables
Another important function of Excel is the creation of pivot tables, which provides grouping data from other tables according to various criteria, performing various calculations with them (summation, multiplication, division, etc.), and the results are displayed in a separate table. At the same time, there are very wide possibilities for setting the fields of the pivot table.

It is created on the tab "Insert" by pressing the button, which is called - "Pivot Table".

Creating charts
To visually display the data placed in the table, it is convenient to use charts. They are often used to create presentations, write scientific works, for research purposes, etc. Excel provides a wide range of tools for creating various types of charts.

To create a chart, you need to select a set of cells with data that you want to visually display. Then, while on the tab "Insert", select on the ribbon the type of chart that you consider the most suitable for achieving your goals.

A more precise setting of charts, including setting its name and the name of the axes, is performed in the group of tabs "Working with charts".

Graphs are one of the types of charts. The principle of their construction is the same as for other types of charts.

Formulas in Excel
To work with numerical data in the program, you can use special formulas. With their help, you can perform various arithmetic operations with data in tables: addition, subtraction, multiplication, division, exponentiation, root extraction, etc. To apply the formula, you need to put a sign in the cell where you plan to display the result. «=» . After that, the formula itself is entered, which can consist of mathematical signs, numbers and cell addresses. To specify the address of the cell from which the data for the calculation is taken, just click on it with the mouse, and its coordinates will appear in the cell to display the result.

Excel is also convenient to use as a regular calculator. To do this, in the formula bar or in any cell, simply enter mathematical expressions after the sign «=» .

"IF" function
One of the most popular functions that are used in Excel is "IF". It allows you to specify in the cell the output of one result when a specific condition is met and another result if it is not met. Its syntax is as follows: IF(logical expression; [result if true]; [result if false]) .

Operators "AND", "OR" and nested function "IF" matches several conditions or one of several conditions.
Macros
With the help of macros in the program, the execution of certain actions is recorded, and then they are played back automatically. This significantly saves time on performing a large amount of the same type of work. Macros are recorded by enabling the capture of their actions in the program through the corresponding button on the ribbon.

Macro recording can also be done using a markup language Visual Basic in a special editor.

Conditional Formatting
To highlight certain data, the table uses a conditional formatting feature that allows you to customize the rules for highlighting cells. The conditional formatting itself can be done as a bar graph, a color bar, or a set of icons. Access to it is via the tab. "Home" with a selection of the range of cells you are about to format. Next in the tool group "Styles" click the button named "Conditional Formatting". After that, it remains to choose the formatting option that you consider the most appropriate.

Formatting will be done.

"Smart" table
Not all users know that a table, simply drawn with a pencil or borders, is perceived by Excel as a simple area of cells. You can force the program to see this data set as a table through reformatting. This is done simply: first, select the desired range with data, and then, being on the tab "Home", click on the button "Format as table". A list will appear with various options design styles, where you specify the appropriate one.

The table is also created by clicking on the button "Table" located on the tab "Insert", having previously selected a certain area of the sheet with data.

The editor will perceive the selected set of cells as a table. As a result, for example, if you enter some data into the cells located at the borders of the table, they will be automatically included in it. In addition to this, when scrolling down, the header will be constantly within the field of view.

Parameter selection
Using the parameter selection function, you can select the initial data, guided by the desired result for you. Go to the tab "Data" and press the button "what if analysis" located in the toolbox "Working with data". In the list that appears, select "Parameter selection...".

The parameter selection window will open. In field "Set in cell" you must reference the cell that contains the desired formula. In field "Meaning" the end result you want to get must be specified. In field "Changing Cell Values" insert the cell coordinates with the value to be adjusted.

INDEX function
Features provided by the function "INDEX", are somewhat close to the capabilities of the function "VPR". It also allows you to search for data in an array of values and return it to a specified cell. The syntax is as follows: INDEX(cell_range, row_number, column_number) .

This is far from complete list all functions that are available in Microsoft program Excel. We have focused only on the most popular and most important of them.
Microsoft Excel is one of the most popular programs to work with big amount data, which is essentially an editor spreadsheets. The wide functionality of the application does not limit the user to the ability to only edit already created tables, but allows you to create completely new ones, with entering your own data.
Lots of built-in Excel math, statistical and other functions allow you to generate reports and perform even the most complex calculations in one click, and a wide library of templates and a charting wizard will easily present all the information in graphical form, with emphasis and highlighting the necessary connections and trends. That is why, if you often have to deal with large amounts of information, make calculations, write reports and do other similar work, you can download Microsoft Excel right now for free and on own experience make sure of all the benefits of working with this software product.
A wide and varied toolkit makes Excel indispensable for people working in the field of economics, finance and accounting. With the help of drawing up tables and hierarchical relationships between them, you can not only store information, but also access the necessary data with lightning speed, using the ability to sort and filter by various criteria.
Features of Microsoft Excel
- Compiling tables with various types data (numeric, text, date, money, time, etc.).
- Extensive formatting options for both the entire sheet and each cell separately.
- Import and export data among other Microsoft Office applications.
- Automatic and customizable sorting of information according to various criteria.
- Built-in data search.
- Use of graphical objects, including charts, graphs and histograms of all kinds.
- High degree of information security.
- Collaboration on projects.
One of the most important advantages of Microsoft Excel is that each user can download free version program and independently evaluate all its advantages. It is worth noting the fact that each new release of Excel contains updates like appearance, and functional content. That is why, before you decide to install specific version to your computer, be sure to read system requirements, which are presented in the description of each issue.
Excel is a spreadsheet program that allows you to store, organize and analyze information. In this lesson, you'll learn some ways to work with the Excel 2010 environment, including the new pop-up menu that replaces the Microsoft Excel 2007 menu button.
We'll show you how to use and modify the ribbon and panel quick access, as well as how to create a new workbook and open an existing one. After this tutorial, you will be ready to start working on your first book in Excel program.
Introduction to Excel 2010
The interface of Excel 2010 is very similar to that of Excel 2007. However, there are some differences, which we'll cover in this lesson. However, if you are new to the Excel environment, then it will take you some time to learn how to navigate Excel.
Excel program interface
1) Quick access bar
The Quick Access Toolbar gives you access to some useful commands no matter what tab you're currently on. By default, the Save, Undo, Redo commands are shown. You can add commands to make the panel more user friendly.
2)Field Name
The Name field displays the position or "name" of the selected cell. In the image below, cell B4 appears in the Name field. Note that cell B4 is at the intersection of column B and row 4.

3) String
A row is a group of cells that runs from the left edge of the page to the right. IN excel strings are indicated by numbers. In the figure below, line 16 is selected.

4) Formula Bar
In the formula bar, you can enter and edit information, formulas, or functions that will appear in a specific cell. In the image below, cell C1 is selected and the number 1984 is entered in the formula bar. Note that the information is displayed both in the formula bar and in cell C1.

5) Sheets
By default, a new workbook contains 3 sheets. You can rename, add or remove sheets.

6) Horizontal scrollbar
You may have more data than what fits on the screen. Click and hold the horizontal scroll bar and move it left or right, depending on which part of the page you want to see.
7) Column
A column is a group of cells that runs from the top of the page to the bottom. IN Excel columns are marked with letters. In the image below, column K is selected.

8) Page View
There are three ways to display a spreadsheet. To select one of them, you need to click on the page view buttons.
- Usual- selected by default, shows you an unlimited number of cells and columns. Highlighted in the picture below.
- Page layout divides the spreadsheet into pages.
- Page lets you see general form spreadsheet, which is useful when you add page breaks.

9) Scale
Click and drag the slider to change the scale. The number displayed to the left of the slider indicates the scale percentage.

10) Ribbon
The ribbon contains all the commands you might need to perform common tasks. It contains several tabs, each with several groups of commands. You can add your own tabs with your favorite commands. In the lower right corner of some groups there is an arrow, by clicking on which you will see even more commands.
Work environment Excel
The Ribbon and Quick Access Toolbar are where you'll find the commands you need to perform common tasks in Excel. If you're familiar with Excel 2007, you'll see that the main difference in the Excel 2010 Ribbon is the placement of commands such as Open and Print on the pop-up menu.
ribbon
The ribbon contains several tabs, each with several groups of commands. You can add your own tabs with your favorite commands.

To customize the Ribbon:
You can customize the Ribbon by creating your own tabs with the commands you need. Teams are always placed in a group. You can create as many groups as you like. What's more, you can add commands to the default tabs, provided you create a group for them.


If you can't find the command you need, click the Select commands drop-down list and select All commands.

To collapse and expand the Ribbon:
The ribbon is designed to be responsive to your current tasks and be easy to use. However, you can minimize it if it takes up too much screen real estate.
- Click the arrow in the upper right corner of the Ribbon to collapse it.
- To expand the Ribbon, click on the arrow again.

When the ribbon is collapsed, you can temporarily display it by clicking on a tab. However, the tape will disappear again when you stop using it.
Quick Access Toolbar
The Quick Access Toolbar is located above the Ribbon and gives you access to some useful commands no matter which tab you're currently on. By default, the Save, Undo, Redo commands are shown. You can add commands to make the panel more user-friendly.
To add commands to the Quick Access Toolbar:
- Click the arrow on the right side of the Quick Access Toolbar.
- Select the commands you want to add from the list that appears. To select commands not listed, click More Commands.

Pop-up menu
The pop-up menu provides you with various options for saving, opening files, printing, or sharing documents. It is similar to the Office Button menu in Excel 2007 or the File menu in earlier versions of Excel. However, now it is not just a menu, but a full-page view that is much easier to work with.
To get to the popup menu:


1) Basic commands
2) Details
Details contains information about the current book. You can view and change its permissions.

3) Latest
For convenience, the latest books you have worked with are shown here.

4) Create
From here, you can create a new blank book or choose from a large number of templates.

5) Print
In the Print panel, you can change the print settings and print your book. You can also preview how the printed book will look like.


7) Help
From here you access Microsoft Office Help or Check for Updates.

8) Options
Here you can change various Excel options. For example, you can change spelling, auto-recovery, or language settings.

Create and open books
Excel files are called workbooks. Each workbook contains one or more worksheets (also known as "spreadsheets").
To create a new book:
- Select Create.
- Select New Book under Available Templates. It is selected by default.
- Click Create. The new workbook will be displayed in the Excel window.

To save time, you can create a document from a template that you can select from Available Templates. But we will talk about this in the next lessons.
To open an existing workbook:
- Click on the File tab. This will open a popup menu.
- Select Open. The Open Document dialog box will appear.
- Select the desired book and click Open.

If you have recently opened existing book, then it could be easier to find it in paragraph Latest in the popup menu.

Compatibility Mode
Sometimes you will need to work with books created in earlier Microsoft versions Excel, such as Excel 2003 or Excel 2000. When you open these workbooks, they are shown in Compatibility View.
Compatibility mode disables some features, so you can only use the commands that were available when the book was created. For example, if you open a workbook created in Excel 2003, you will be able to use the tabs and commands that were in Excel 2003.
In the image below, the workbook is open in compatibility mode.

To exit compatibility mode, you need to change the book format to the current version. However, if you work with people who work with more early versions Excel, it's best to leave the workbook in Compatibility Mode and not change the format.
To convert a book:
If you want to have access to all the features of Excel 2010, you can convert the workbook to excel format 2010.
Please note that converting a file may cause some changes to the original file.
- Click the File tab to open the pop-up menu.
- Select the Transform command.
- Then press ok twice.


- The book will be converted to the new format.
Practice!
- Open Excel 2010 on your computer and create a new blank workbook.
- Collapse and unfold the ribbon.
- Go through all the tabs and notice how the ribbon options change.
- Try changing the look of the pages.
- Add any commands to the Quick Access Toolbar.
- Close Excel without saving the workbook.
Microsoft Excel (also sometimes referred to as Microsoft Office Excel) is a spreadsheet program created by Microsoft Corporation for Microsoft Windows, Windows NT and Mac OS. It provides economic and statistical calculation capabilities, graphical tools, and, with the exception of Excel 2008 under Mac OS X, the VBA (Visual Basic for Applications) macro programming language. Microsoft Excel is part of Microsoft Office and today Excel is one of the most popular programs in the world.
A valuable feature of Excel is the ability to write code based on Visual Basic for Applications (VBA). This code is written using a separate editor from tables. The spreadsheet is managed using an object-oriented code and data model. With this code, the data of the input tables will be instantly processed and displayed in tables and charts (graphs). The table becomes the interface of the code, making it easy to work with, change it, and manage calculations.
Excel can be used to analyze large amounts of data. In Excel, you can use more than 400 mathematical, statistical, financial and other specialized functions, link different tables to each other, choose arbitrary data presentation formats, create hierarchical structures. Truly limitless methods graphic representation data: in addition to several dozen built-in chart types, you can create your own, customizable types that help visualize the subject of the chart. Those who are just learning how to work with Excel will appreciate the help of the "masters" - auxiliary programs, which help when creating diagrams. They, like good wizards, asking leading questions about the foreseen further steps and showing, depending on the planned answer, the result, will guide the user "by the hand" through all the stages of building a diagram in the shortest way.
Working with a table is not limited to simply entering data into it and building charts. It is hard to imagine an area where the analysis of these data would not be required. In Excel included powerful tool analysis - Pivot table. It can be used to analyze spreadsheets, contain a large number of unsystematized data, and with only a few clicks of the mouse button to bring them into a convenient and readable form. Mastering this tool is simplified by the presence of the appropriate wizard program.
There are two main types of objects in Microsoft Excel: book and letter.
Book in Microsoft Excel is a file that is used to process and store data. Each book can consist of several sheets, so you can put a variety of information in one file and establish the necessary links between them.
Letters are used to organize and analyze data that can be entered and edited simultaneously on multiple sheets, and to perform calculations based on data from multiple sheets. After creating a chart, you can place it on a letter with the corresponding data or on a separate letter of the chart.
Sheet names are displayed on tabs at the bottom of the workbook window. To switch from one letter to another, you need to specify the appropriate label. The name of the active sheet is in bold.
Microsoft Excel has a lot of different functions, for example:
1. Financial, among many special functions that calculate interest on a deposit or loan, depreciation, rate of return and a variety of inverse and related quantities.
2. Date and time functions- most of the functions in this category are in charge of converting dates and times to different formats. Two special functions TODAY and TODAY insert the current date (first) and date and time (second) into the closet, updating them each time the file is called or any changes are made to the table.
5. Reference and arrays. This category contains functions that allow you to access an array of data (by column, row, rectangular interval) and get a variety of information from it: the numbers of columns and rows, it includes, their number, the contents of the array element you need; you can find in which closet of this array the desired number or text, etc.
6. Text– There are two dozen teams in this group. With their help, you can count the number of characters in the collar, including spaces (DLSTR), find out the character code (CODE), find out which character is the first (LEFT) and last (RIGHT) in a line of text, put a certain number of characters from another into the active closet collars (PSTR), put all the text from another cell in capital (UPPER) or small letters (LOWER) into the active cell, check if two text cells match (EXACT), find some text (SEARCH, FIND) and replace it with another one (REPLACE ).
7. Checking properties and values- here are commands with which you can get information about the type of data in the collar (the number is there, text or some other information), about the format, about the current operating environment, about common mistakes, which appeared in the formula, etc..
8. Working with the database- here you can find statistical accounting commands (BDDISP - variance for a sample from the base, BDDISP - variance for the general population, DSTANDOTKL - standard deviation for the sample), operations with columns and rows of the base, the number of non-empty (BSCOUNT) or (BSCOUNT) cells, etc. .d.
9. Chart Wizard- built-in EXCEL program, which simplifies the work with the main features of the program.
Purpose of MS Excel.
MS Excel is one of the most popular spreadsheet programs today. It is used by scientists, accountants, journalists, etc., with its help they maintain various tables, lists and catalogs, compile financial and statistical reports, calculate the state of a commercial enterprise, process the results of a scientific experiment, keep records, prepare presentation materials. The possibilities of Excel are very high. Word processing, database management - the program is so powerful that in many cases it surpasses specialized editor programs or database programs. Such a variety of functions can be confusing at first, than forced to be applied in practice. But as you gain experience, you begin to appreciate what borders Excel features hard to achieve.
Over the long history of tabular calculations using personal computers user requirements for similar programs have changed significantly. At first, the main emphasis in a program such as VisiCalc was placed on counting functions. Today, along with engineering and accounting calculations, the organization and graphic presentation of data is becoming increasingly important. In addition, the variety of functions offered by such a calculation and graphics program, should not complicate the user's work. Windows programs create ideal conditions for this. Recently, many have just switched to Windows usage as his user environment. As a result, many firms that create software, began to offer a large number of programs for Windows.
Excel provides both ease of handling data and its safety. Excel allows you to quickly complete the work for which you do not need to spend a lot of paper and time, as well as involve professional accountants and financiers.
This program will be able to calculate sums by rows and columns of tables, calculate the arithmetic mean, bank interest or variance, here you can generally use a set standard features: financial, mathematical, logical, statistical.
Excel has many more advantages. This is very flexible system"grows" along with the needs of the user, changes its appearance and adapts to you. The basis of Excel is a field of cells and a menu at the top of the screen. In addition, up to 10 toolbars with buttons and other controls can be located on the screen. It is possible not only to use standard toolbars, but also to create your own.
Conclusion.
In order to know Excel, you need to work in it. Using this program, you will surely discover more and more new features and properties. Explore and experiment. If you don't like the results, try again. Almost everything you do in Excel can be undone, so experimenting won't waste anything but a few minutes of your time.
Microsoft Excel spreadsheet program (hereinafter, for brevity, Excel titles or MS Excel), as well as the text editor MS Word, is included in the packages of the Microsoft Office family. At present, MS Excel 7.0, MS Excel 97, MS Excel 2000 versions are mainly used, which are included in the MS Office 95, MS Office 97 and MS Office 2000 packages, respectively. The manual deals with general issues of working with a spreadsheet program, which are presented in one form or another in all the versions mentioned. Therefore, the manual does not specify the version of the program anywhere. The examples given in the manual were obtained in MS Excel 97.
Purpose of MS Excel
MS Excel is a powerful and fairly easy-to-use spreadsheet processing package designed to solve a wide range of planning, economic, accounting, statistical, scientific, technical and other tasks in which numerical, textual or graphic information with some regular, repeating structure is presented in tabular form. Spreadsheet just like a regular table, it consists of rows and columns at the intersection of which are located cells. However, unlike an ordinary spreadsheet, a spreadsheet serves not only for visual representation of numerical, textual and graphic information.
The main difference between a spreadsheet and a regular spreadsheet is the ability to place various calculation formulas in its cells, as well as in a wide automation processing the data presented in a tabular form. Let, for example, in one column of the table there is income various organizations for a certain period, and in another column you need to put income tax, which is calculated in a certain way depending on the income received. Instead of manually calculating the tax, you can write the corresponding calculation formulas in the cells of this column, and the Excel program she will calculate tax and put the corresponding values in the right cells instead of standing there. formulas. That's why Excel program quite often called processor spreadsheets.
Main features of MS Excel
The MS Excel spreadsheet program provides the user with a rich set of options for creating and modifying tables that can contain numbers, text, dates, currencies, graphics, as well as mathematical and other formulas for performing calculations. Entering data into tables, formatting them, and performing various kinds of calculations are largely automated. Means are provided for representing numerical data in the form of diagrams, creating, sorting and filtering lists, statistical data analysis and solving optimization problems.
In addition to specific tools specific to working with spreadsheets, MS Excel has a standard for Windows applications a set of file operations, has access to the clipboard and undo and redo mechanisms.
MS Excel documents are written to files with the .xls extension. In addition, MS Excel can work with spreadsheets and charts created in other common packages (for example, Lotus 1-2-3), as well as convert the files it creates for use by other programs.
The main features and tools of MS Excel:
Wide possibilities for creating and modifying tables of arbitrary structure;
Autocomplete table cells;
Rich set of table formatting options;
A rich set of various functions for performing calculations;
Automating the construction of diagrams of various types;
Powerful mechanisms for creating and processing lists (databases): sorting, filtering, searching;
Mechanisms for automating the creation of reports.
In addition to specific spreadsheet programs, MS Excel has a number of features and tools used in text editor MS Word and in other applications of the MS Office package, as well as in operating system windows:
Powerful built-in reference system, availability of context-sensitive help;
Changing the forms of the text cursor and mouse pointer when the current situation in the editor changes, making it easier for the user to navigate in the program and possible own actions;
A set of blanks (templates) of documents, the presence of masters - subsystems that automate work on standard documents in standard situations;
Ability to import - convert files from formats of other spreadsheet programs to MS Excel format, and export - convert files from MS Excel format to formats of other programs;
Access to the clipboard, which allows you to transfer fragments both within the same document and between different documents and applications;
Mechanisms for undoing and restoring the last actions performed after it (rollback and rollback);
Finding and replacing substrings;
Means of automating work with documents - auto-correct, auto-format, auto-transfer, etc.;
Possibilities for formatting characters, paragraphs, pages, creating a background, framing, underlining;
Checking the correct spelling of words (spelling) using the built-in dictionary in different languages;
Extensive opportunities for managing the printing of documents (determining the number of copies, selective printing of pages, setting the print quality, etc.);